

Peering through Jupiter’s storms with Gemini
The Hawai‘i-based Gemini North telescope joined forces with NASA’s Hubble Space Telescope and Juno spacecraft to work out what’s happening inside the gas giant’s Great Red Spot
Profile
Facility Profiles
Name:
-
Gemini North
Location:
-
Maunakea, Hawai‘i
Optical design:
-
Ritchey–Chrétien Cassegrain
Primary mirror diameter:
-
8.1 meters
Operational waveband:
-
Optical/Infrared
First light:
-
1999
Altitude:
-
4124 meters
Science goals:
-
Observatories work together to provide the best images and a complete, clear view of Earth’s sky
-
World leader in wide-field adaptive-optics-assisted infrared imaging, supporting research in almost all areas of astronomy
-
Provides the lowest possible emissivity of all telescopes for optimal infrared observing from the ground
Name:
-
Hubble Space Telescope
Operator:
-
NASA, ESA, Space Telescope Science Institute
Optical capabilities:
-
Ultraviolet through to infrared
Launch date:
-
April 1990
Primary science goal:
-
Peering into the observable Universe so that scientists can better understand it
Name:
-
Juno
Operator:
-
NASA/Jet Propulsion Laboratory
Optical capabilities:
-
Ultraviolet through to infrared
Launch date:
-
August 2011
Primary science goal:
-
Improve our understanding of our Solar System’s beginnings by studying Jupiter’s origin and evolution
11 May 2021
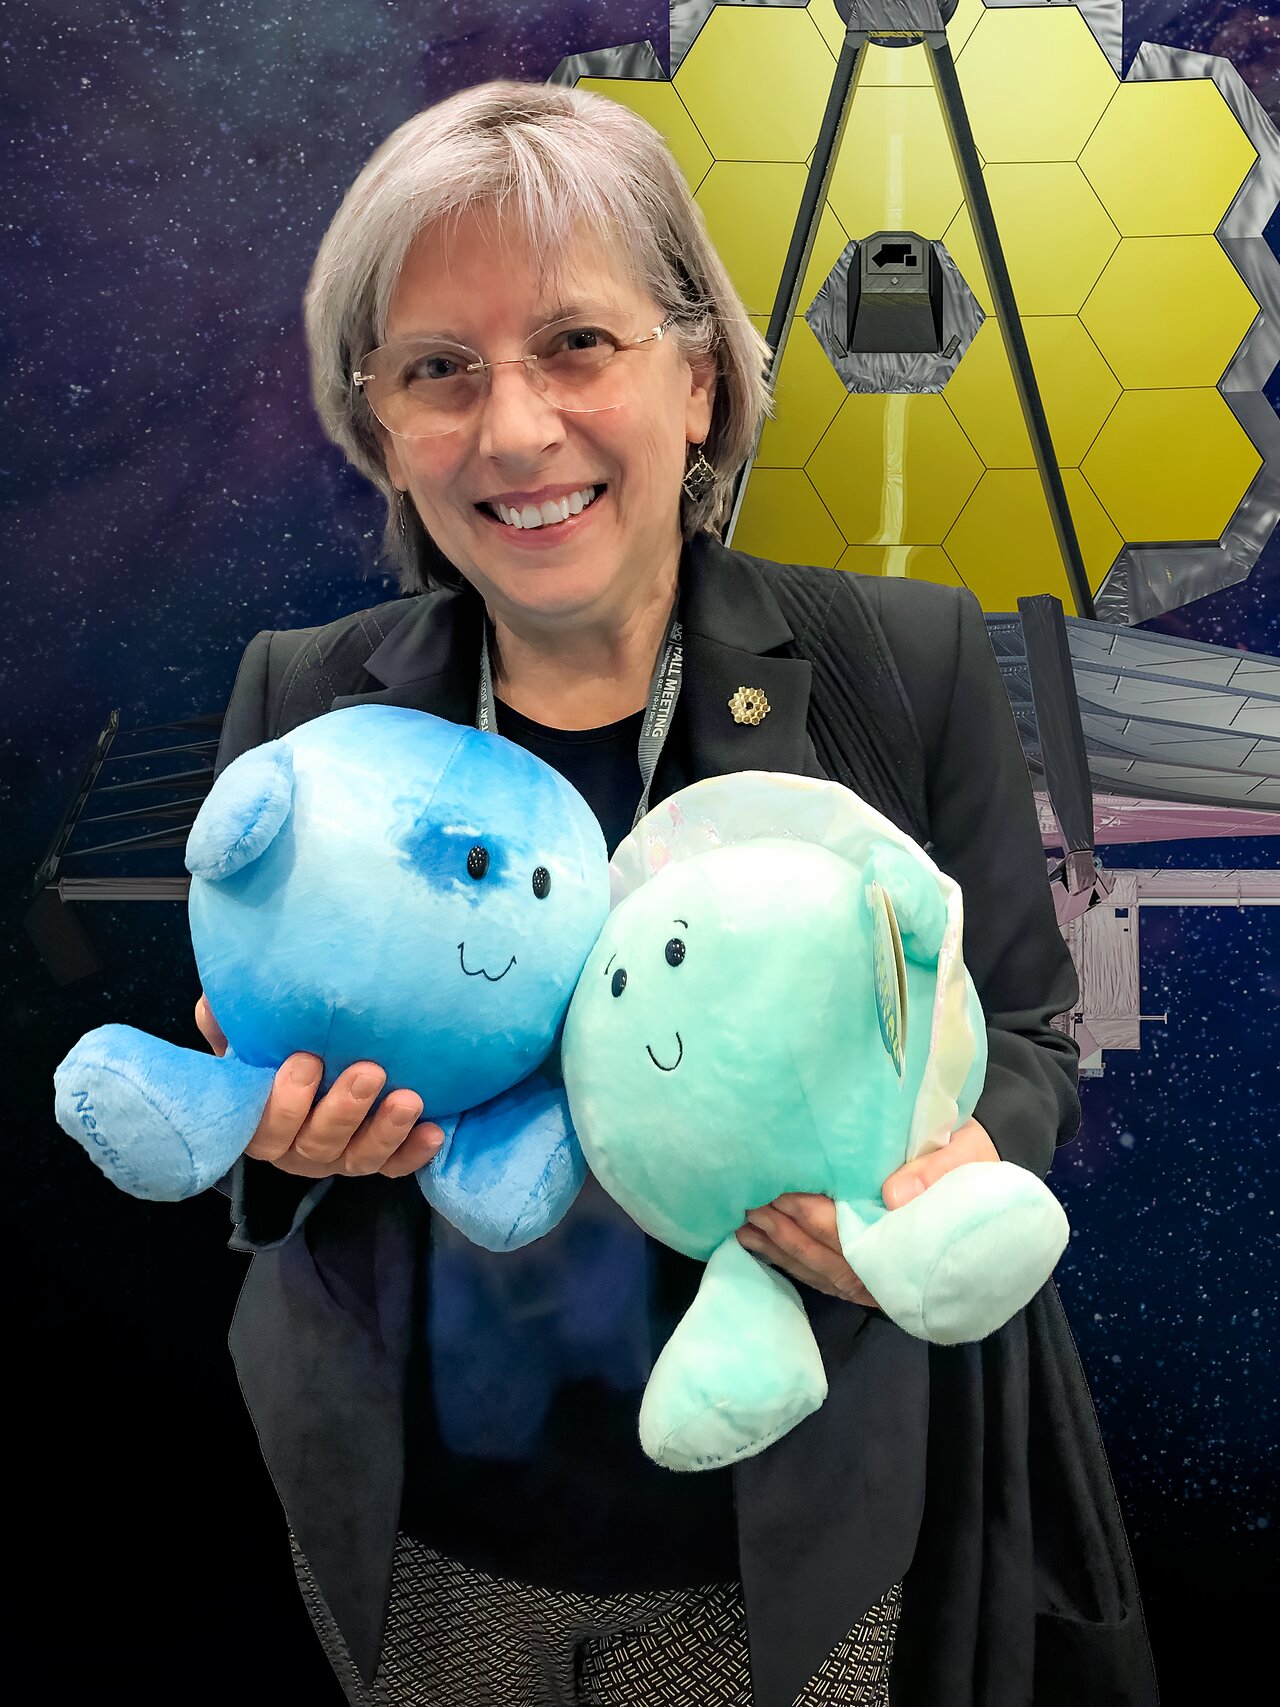
During the global pandemic, planetary astronomer Heidi Hammel has achieved a long-term ambition: learning to play the oboe. Sometimes Hammel, who is the Vice President for Science at AURA’s Corporate Office, takes part in online recitals with others over Zoom. It takes careful coordination, but while each person playing an instrument in their home can only provide a portion of a symphony, when taken as a whole over the Internet, the combination of all the musicians leads to the creation of a far more complicated musical piece.
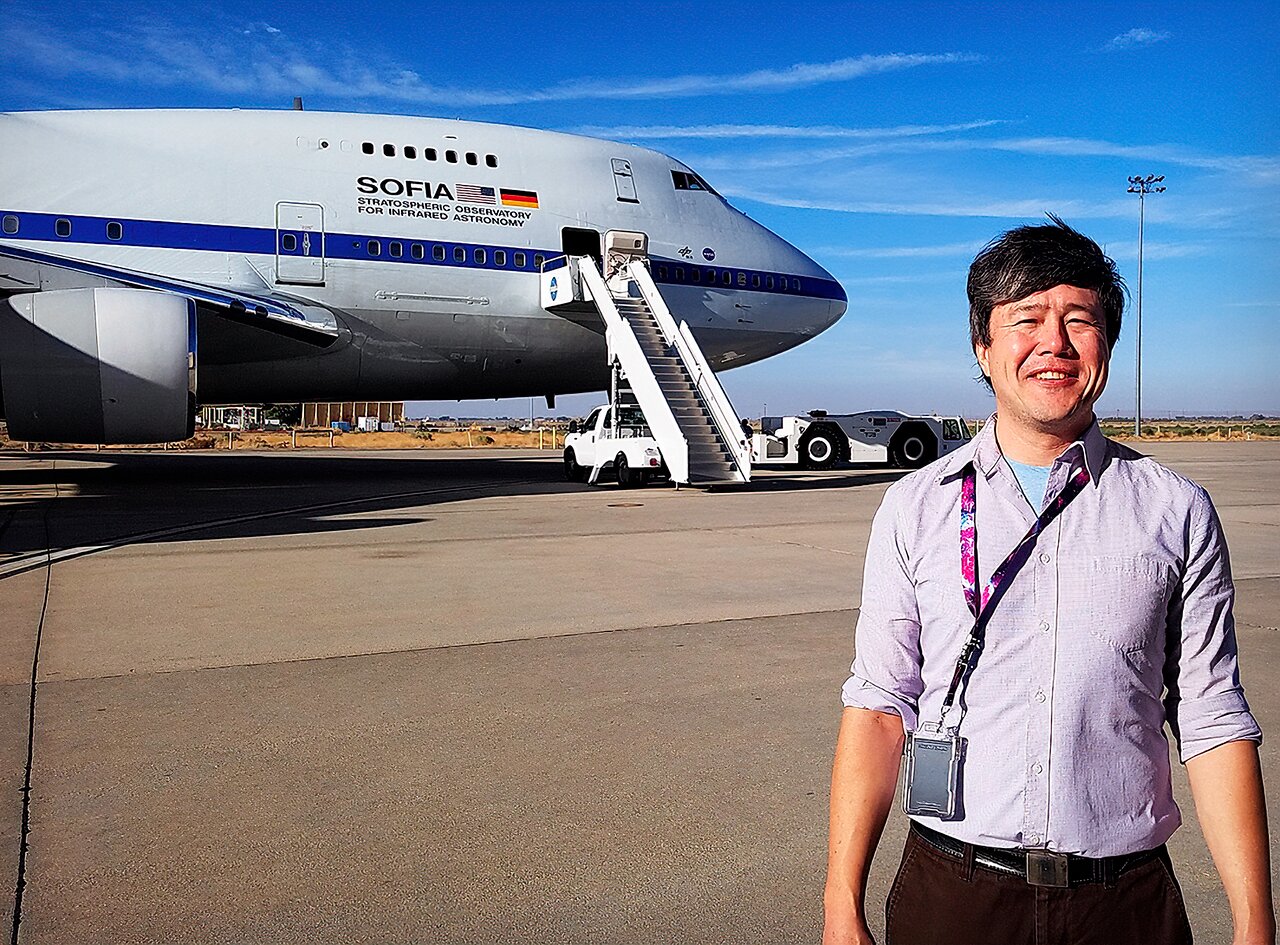
In the same way, NOIRLab’s Gemini North telescope is similar to those singular musicians when it comes to observing Jupiter with its Near Infrared Imager, or NIRI for short. However, Hammel’s frequent scientific collaborator, Mike Wong of the University of California, has combined NIRI’s observations with optical and ultraviolet data from the Hubble Space Telescope, along with radio signals detected by NASA’s Juno spacecraft, to create a kind of planetary symphony.
In doing so, Wong’s team has shown how lightning storms on Jupiter form, and that the planet’s famous Great Red Spot has holes in its clouds that allow Gemini to see through to deeper, warmer layers below.
“What’s really cool about the work that Mike has been doing — by combining the Hubble observations with those from Gemini and the Juno spacecraft — is that it’s a really powerful example of how using different tools in our arsenal is a far more powerful way to study planetary objects than just picking one alone,” says Hammel.
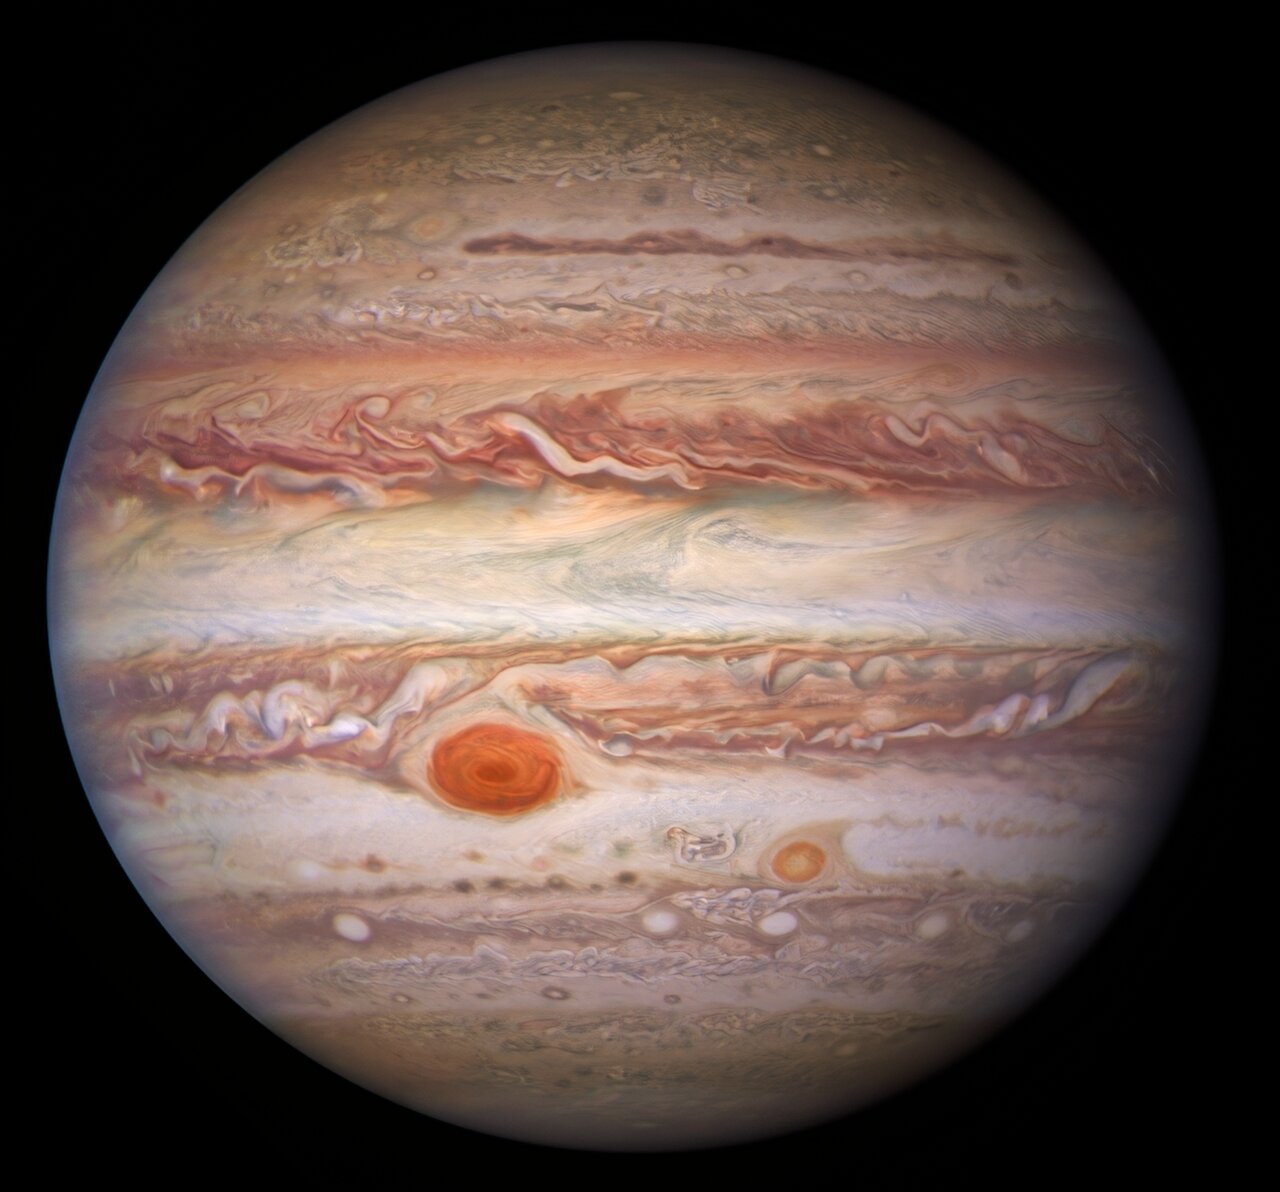
The radio signals that Juno detected are from fierce blasts of lightning in Jupiter’s atmosphere. Hubble observations show bright clouds in those regions, the tops of towering convective storm clouds within a powerful cyclone. But what is driving those storm clouds?
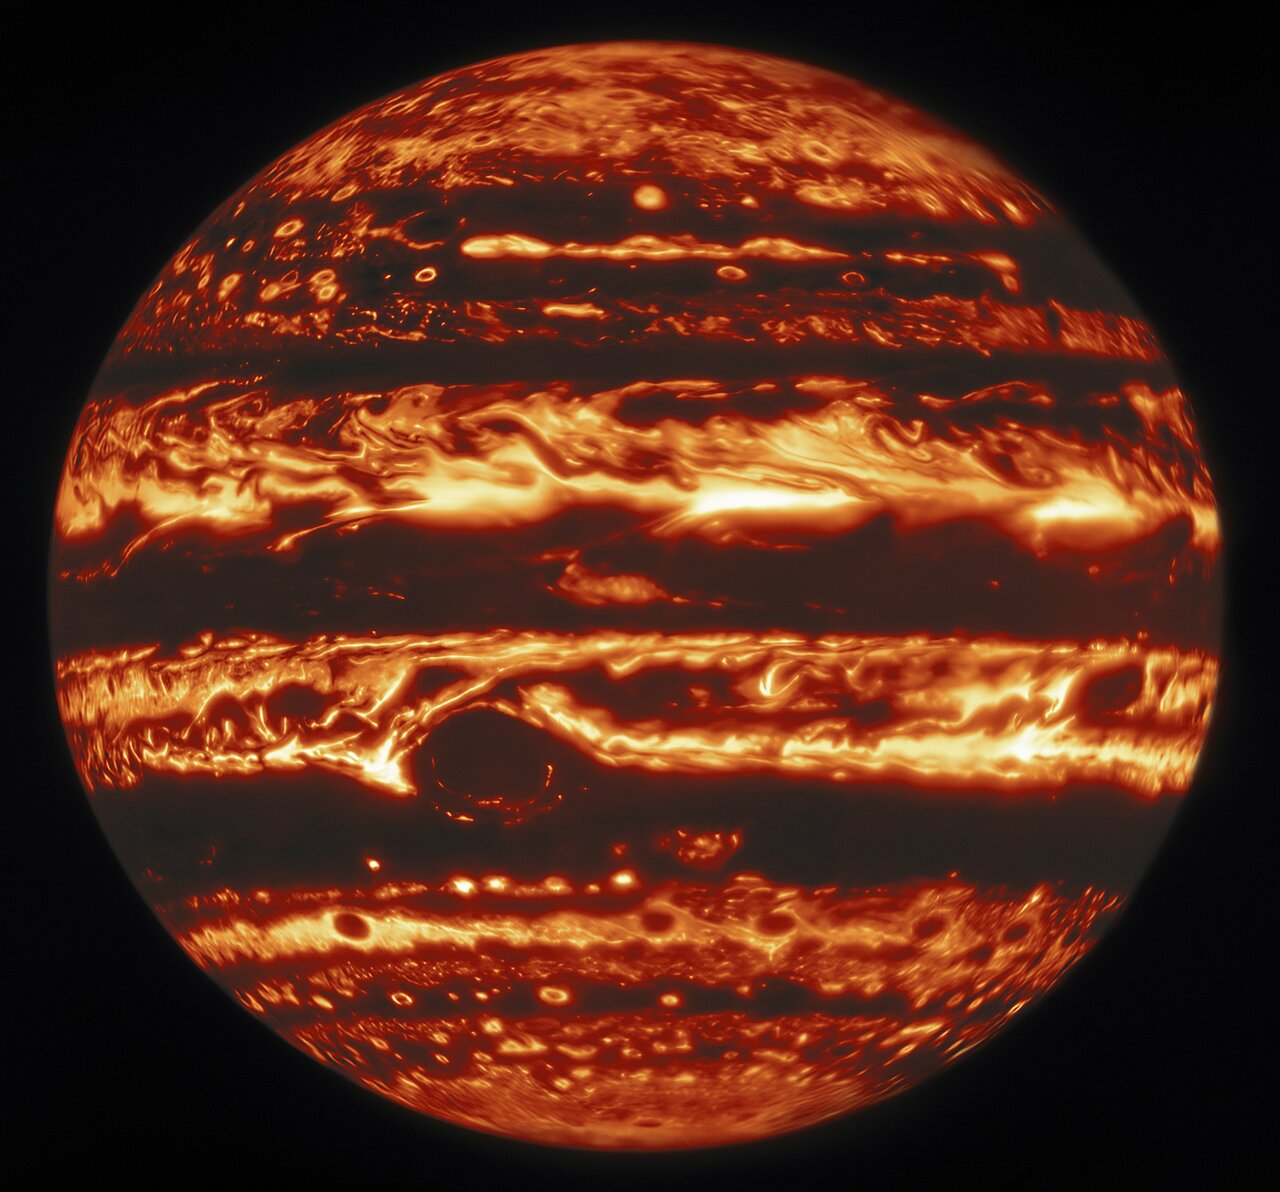
This is where Gemini came in. “Previous NASA spacecraft data had shown that regions with active convection, as marked by lightning activity, contained both towering convective plumes and clouds so deep they must be formed by condensed water,” explains Wong. “Gemini revealed that these active regions are also dotted with infrared-bright spots, where turbulent downdrafts create clearings in the cloud decks. Data from Juno, Gemini and Hubble were then combined to map the cloud structure of stormy convective regions in three dimensions, especially the different types of cyclonic vortices.”
“Juno detected a whole bunch of lightning flashes at radio wavelengths that are associated with cyclones,” continues Wong. “And we interpreted the data to show that when you have active convection, which is generating the lightning, you have this particular situation where there’s three types of clouds all jumbled together in one place: the really tall convective towers, clearings where Gemini detects bright emission, and deep water clouds.”
At the edge of Jupiter’s Great Red Spot, wind speeds reach between 430 and 680 kilometers per hour — that’s more than twice the speed of the hurricanes here on Earth!
Hubble has the advantage of being in space without the distorting effect of Earth’s atmosphere, but the ground-based Gemini North still has to battle against this deleterious twinkling. So Wong’s team used a technique called “lucky imaging”: Gemini takes many images of Jupiter in rapid succession (one frame with an exposure time of 0.31 seconds is taken every five to six seconds), and Wong uses computer algorithms to select the exposures most free of atmospheric distortion. “We use 38 source frames per pointing, and select the best ten percent of them,” says Wong. “Originally we were using 76 frames, but we lowered this in order to make the proposal more competitive for Gemini North, which is in high demand.” Consequently, Gemini captured some of the sharpest infrared images of Jupiter ever taken from the ground, able to see details as small as 500 kilometers across — which sounds big, but when you consider that the gas giant is 140,000 kilometers across and about 900 million kilometers away, these features are actually quite small.
Gemini’s observations also led to an additional, and surprising, finding. While looking for clearings through which Jupiter’s internal heat leaks at infrared wavelengths, Wong and his colleagues noted that the Great Red Spot appears riddled with holes. In visible light, these gaps look like dark clouds, but Gemini showed that there were no clouds there.
Though the holes are not yet fully explained, Wong draws an analogy with ocean currents in Earth’s seas. “The closest analog is eddies in the ocean,” he says. “As the storm clouds spin, you can get little anomalies from these eddies that form streaks by just winding up. And that's kind of the shape that we're seeing in these holes. So it's probably just some weak turbulence, but as it spins, it gets stretched out.”
It’s a really powerful example of how using different tools in our arsenal is a far more powerful way to study planetary objects than just picking one alone.
The multi-year program linking Gemini with Hubble and Juno is far from over. The trio are able to keep track of changes in the Jovian atmosphere, showing how cloud features evolve over time. Wong is now working on a paper that will chip away at one of the greatest mysteries of the Jovian atmosphere: why and how is the Great Red Spot shrinking?
In the 19th Century, the Great Red Spot was measured to be about 40,000 kilometers across, whereas today it appears to be just 15,800 kilometers in diameter. However, defining where the spot begins and ends isn’t entirely clear. The spot has been seen to change color over the years; do we define its diameter as the region of the atmosphere colored red by the storm? Wong’s analysis uses another way, by measuring the velocity of the winds and surrounding atmosphere.
“You can measure the spot’s size based on the red color, or you can measure how the winds are blowing and use the peaks of the highest wind speeds [as a proxy for the extent of the spot],” he says. “And that's something that the dynamicists think is more accurate for defining the size of the Great Red Spot.”
You have this particular situation where there’s three types of clouds all jumbled together in one place: the really tall convective towers, clearings where Gemini detects bright emission, and deep water clouds.

The Gemini observations, or the Juno or Hubble data for that matter, are not thrown away at the end of Wong’s study. They are kept in NOIRLab’s Community Science and Data Center (CSDC) for all astronomers in the future.
“Even though Mike might be mostly done with his data, there may be some young whippersnapper coming along after him who might have a different science question that he or she will probe using the dataset that Mike has taken,” says Hammel. “They might use it for a completely new scientific purpose that no one has even imagined at this time.”
In this way, Gemini’s observations will leave a lasting legacy that will be available to astronomers well into the future, perhaps even far outlasting the observatory itself! Who knows what discoveries will be made in the future from observations that NOIRLab scientists and facilities are making today?
Links
