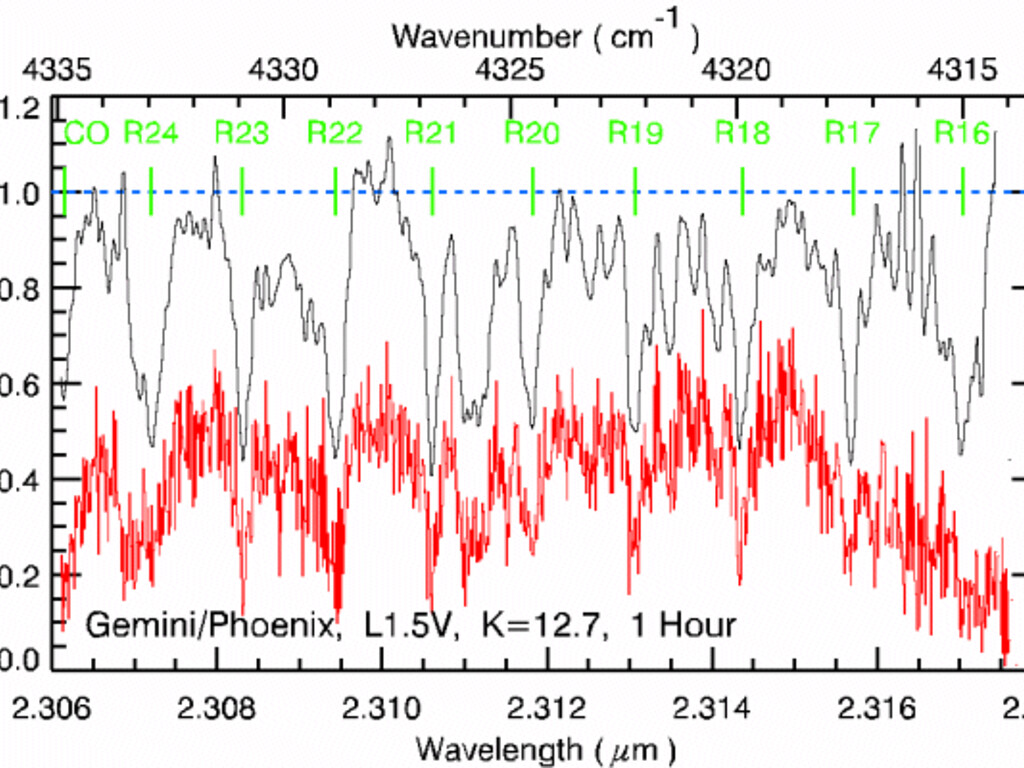
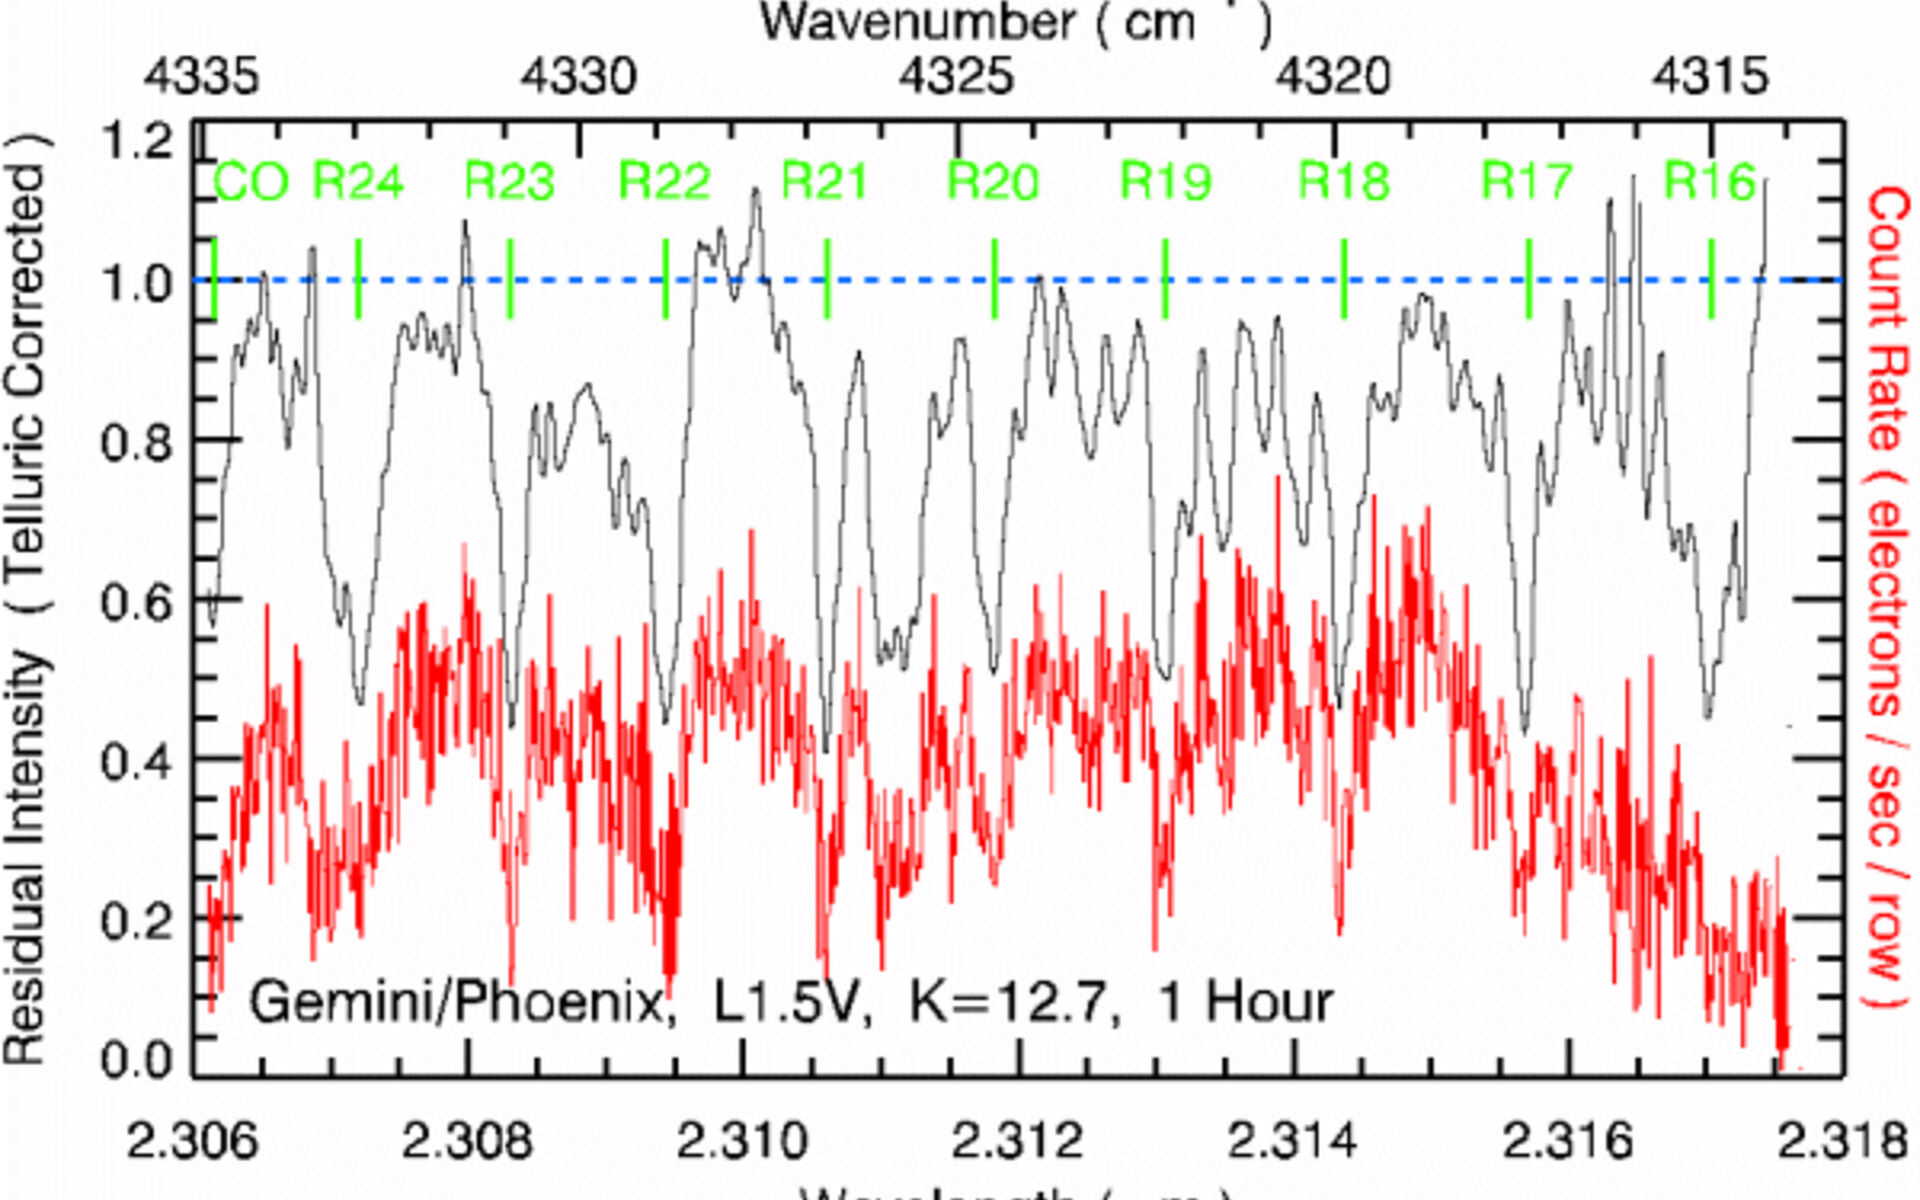
Spectrum of a K=12.7 mag early L-type dwarf

The figure shows the spectrum of a K=12.7 mag early L-type dwarf . In the figure the raw count rate spectrum is shown in red (in electrons per summed row) and the continuum normalized, telluric corrected spectrum is shown in black. The latter has been convolved with a 5 pixel wide Gaussian averaging over the slit width. The strong CO lines are labeled across the top of the plot. There are also strong H2O features present which are not labeled.
Credit:Ken Hinkle [NOAO] and Jeff Valenti [STScI]; Hinkle et al (in preparation).
About the Image
| Id: | geminiann02001b |
| Type: | Chart |
| Release date: | Feb. 22, 2002, 5 a.m. |
| Related announcements: | geminiann02001 |
| Size: | 600 x 400 px |
About the Object
| Category: | Illustrations |