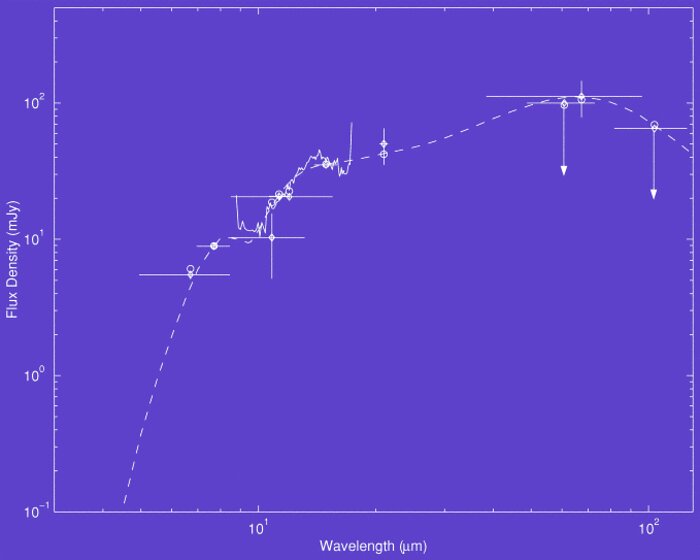
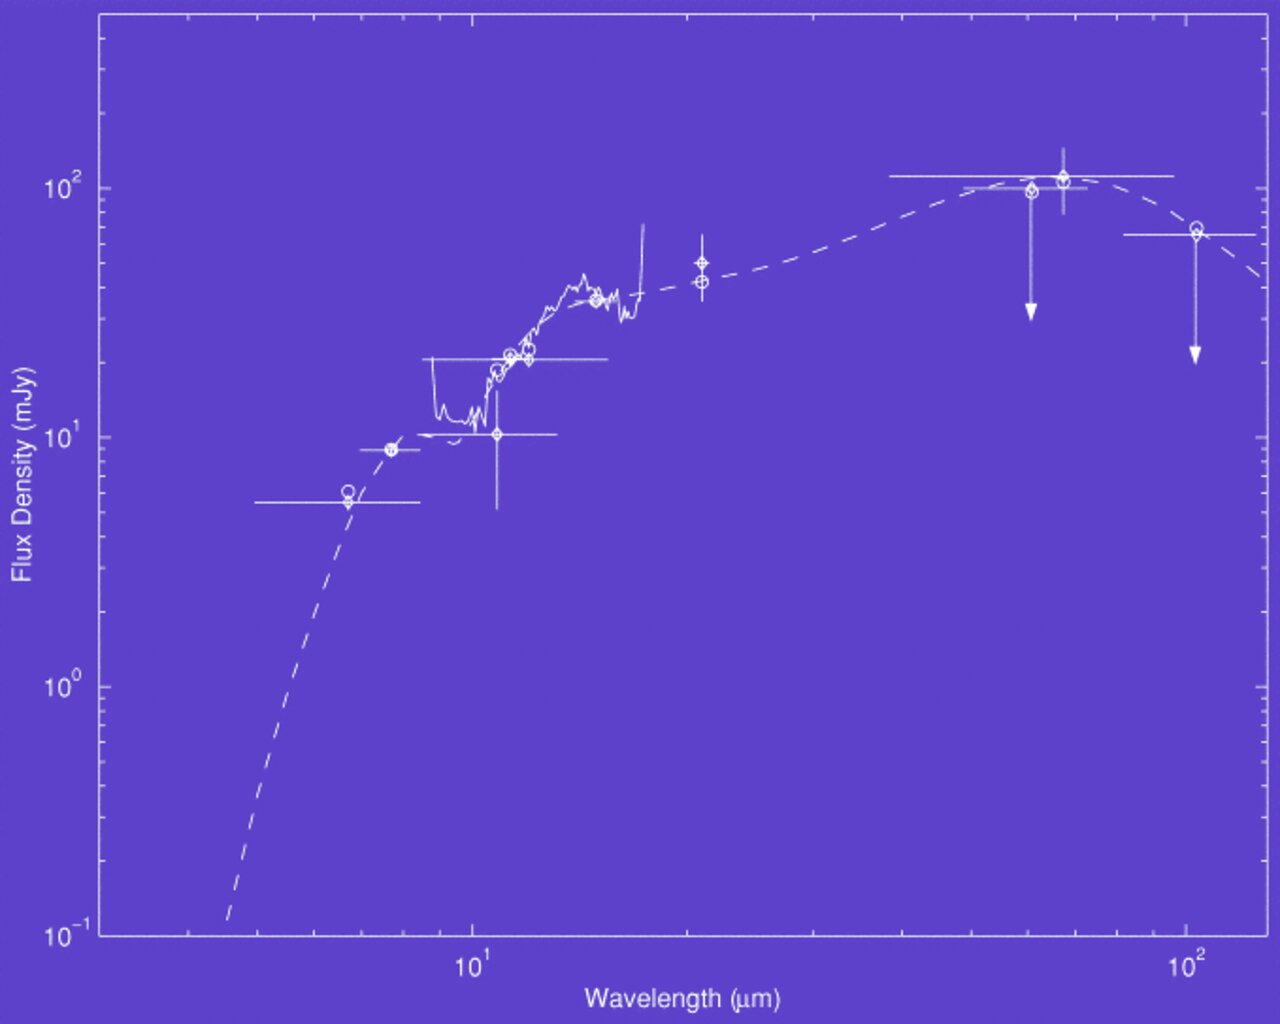
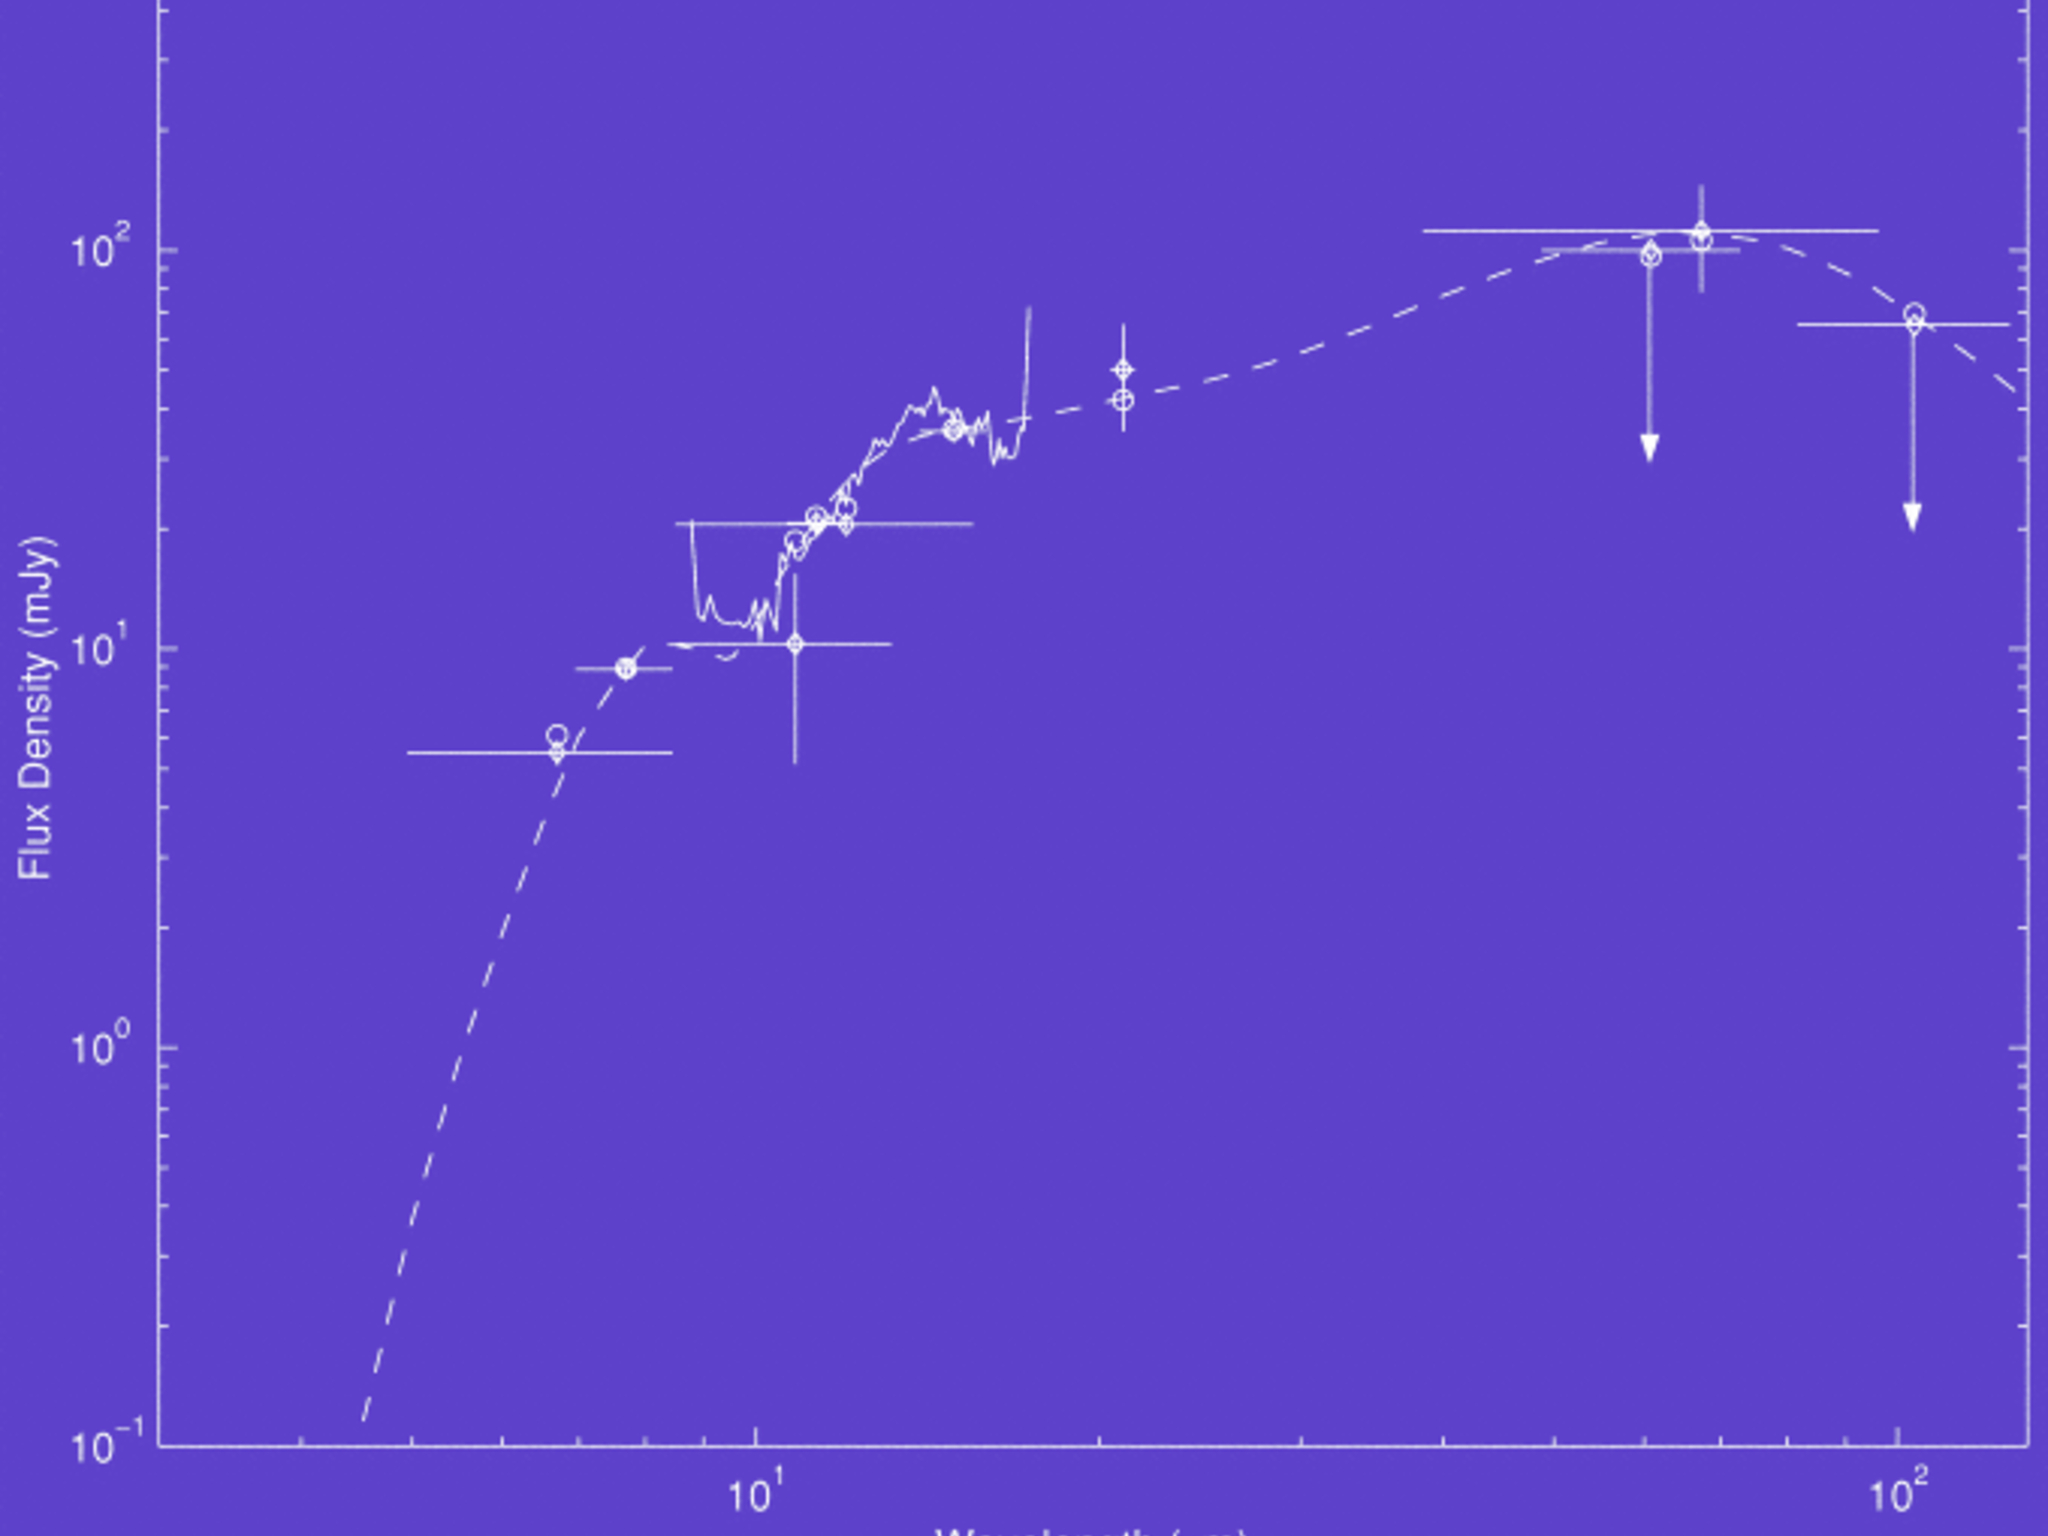
Infrared spectral energy distribution of SBS 0335-052
Infrared spectral energy distribution of SBS 0335-052. Symbols with error bars represent the observed broadband photometric data (OSCIR and ISOPHOT), while the solid line is the ISOCAM spectrum. Open circles represent model fluxes in the same spectral windows synthesized using the model DUSTY.
Credit:International Gemini Observatory/NOIRLab/NSF/AURA
About the Image
| Id: | geminiann02009a |
| Type: | Chart |
| Release date: | Oct. 9, 2002, 5 a.m. |
| Related announcements: | geminiann02009 |
| Size: | 679 x 543 px |
About the Object
| Name: | Gemini North |
| Category: | Galaxies |