GMOS-S IFU spectrum of “E+A”
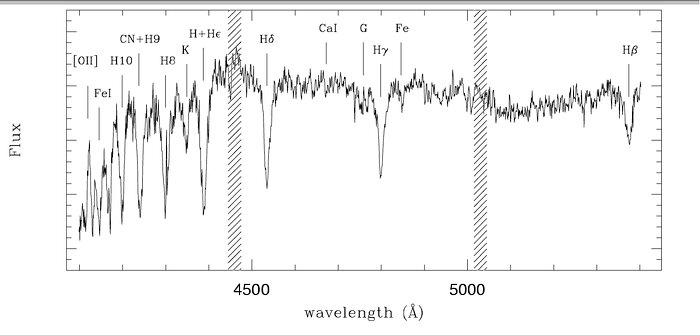
GMOS-S IFU spectrum of “E+A” obtained by collapsing the central two square arcseconds of the galaxy. The strongest emission and absorption features used for this study are indicated. The hashed region shows the positions of the GMOS CCD chip gaps.
Credit:International Gemini Observatory/NOIRLab/NSF/AURA
About the Image
| Id: | geminiann05002c |
| Type: | Chart |
| Release date: | Feb. 23, 2005, 2:52 p.m. |
| Related announcements: | geminiann05002 |
| Size: | 1245 x 596 px |
About the Object
| Category: | Illustrations |