Example of GMOS spectra for one cluster in the sample (T390)
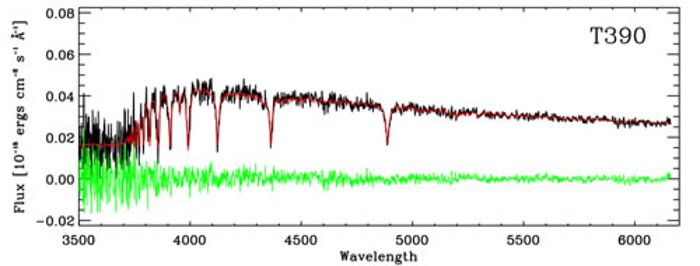
Example of GMOS spectra for one cluster in the sample (T390) used for this work. The observed spectrum has been corrected for the estimated interstellar extinction. The black line represents the observed spectra, red line the best-fitting model template (age and metallicity) and green line the residual (observed cluster−best-fitting template). The calculated age and metallicity T390 are ~200 Myr and 1.1 Zsun (essentially solar).
Credit:International Gemini Observatory/NOIRLab/NSF/AURA
About the Image
| Id: | geminiann09016c |
| Type: | Chart |
| Release date: | July 14, 2009, 1:35 p.m. |
| Related announcements: | geminiann09016 |
| Size: | 500 x 190 px |
About the Object
| Name: | Gemini Multi-Object Spectrograph (GMOS) |
| Category: | Illustrations |