Collapsed one-dimensional NIFS spectrum showing the emission line profiles fitted

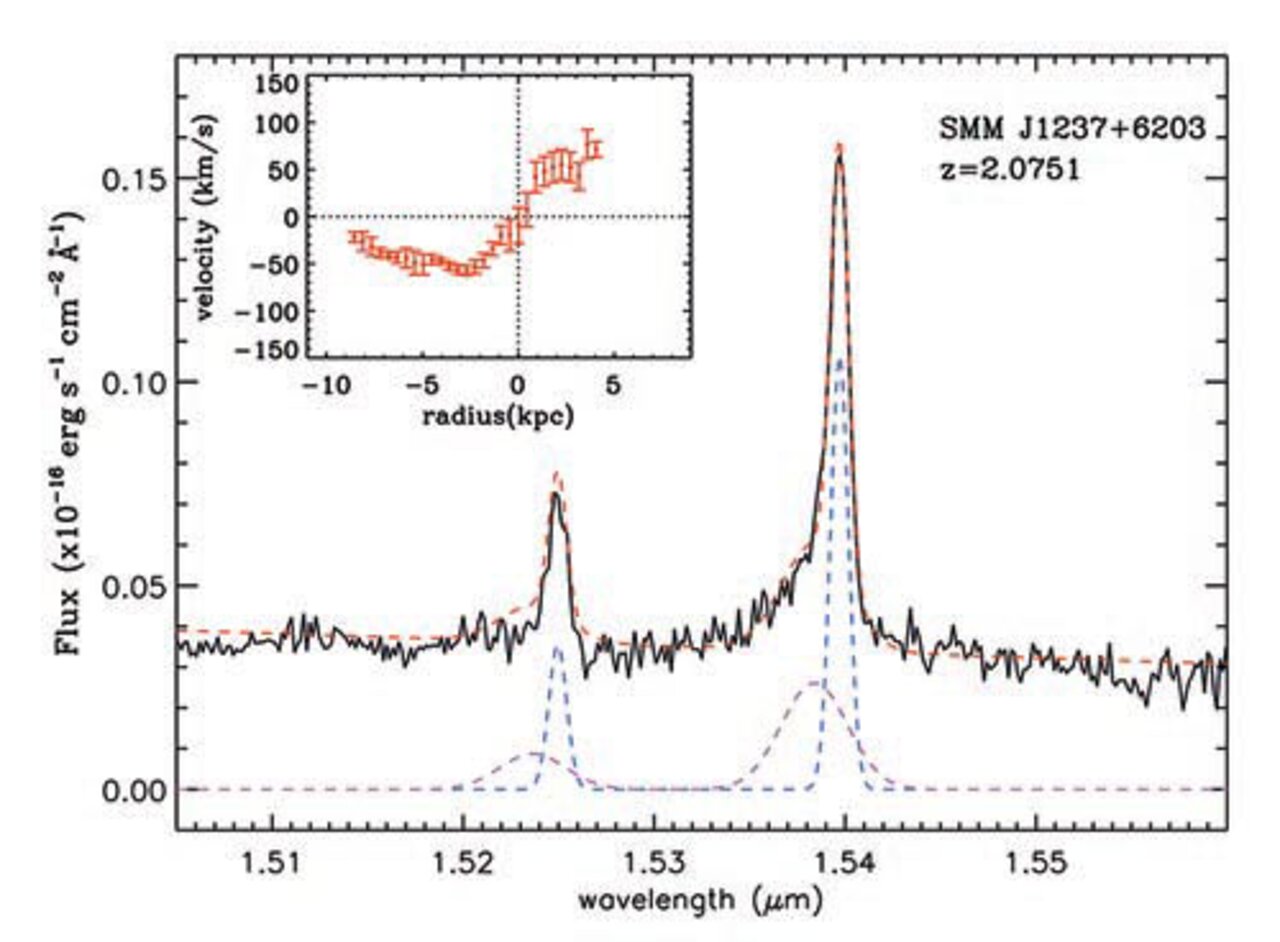
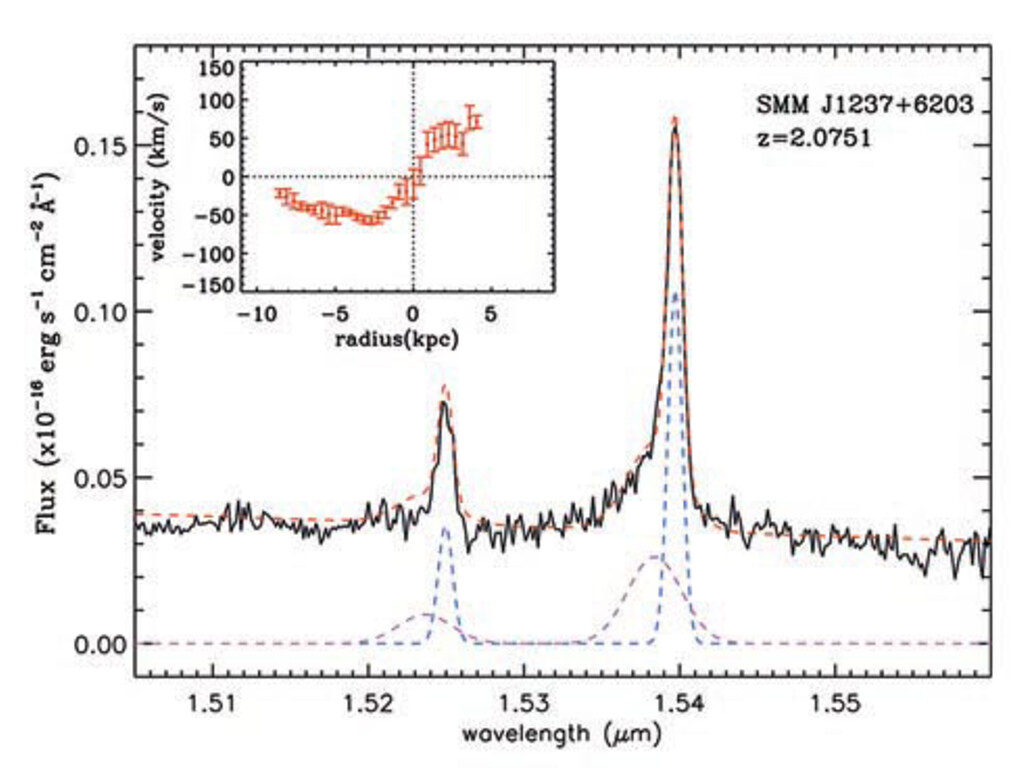
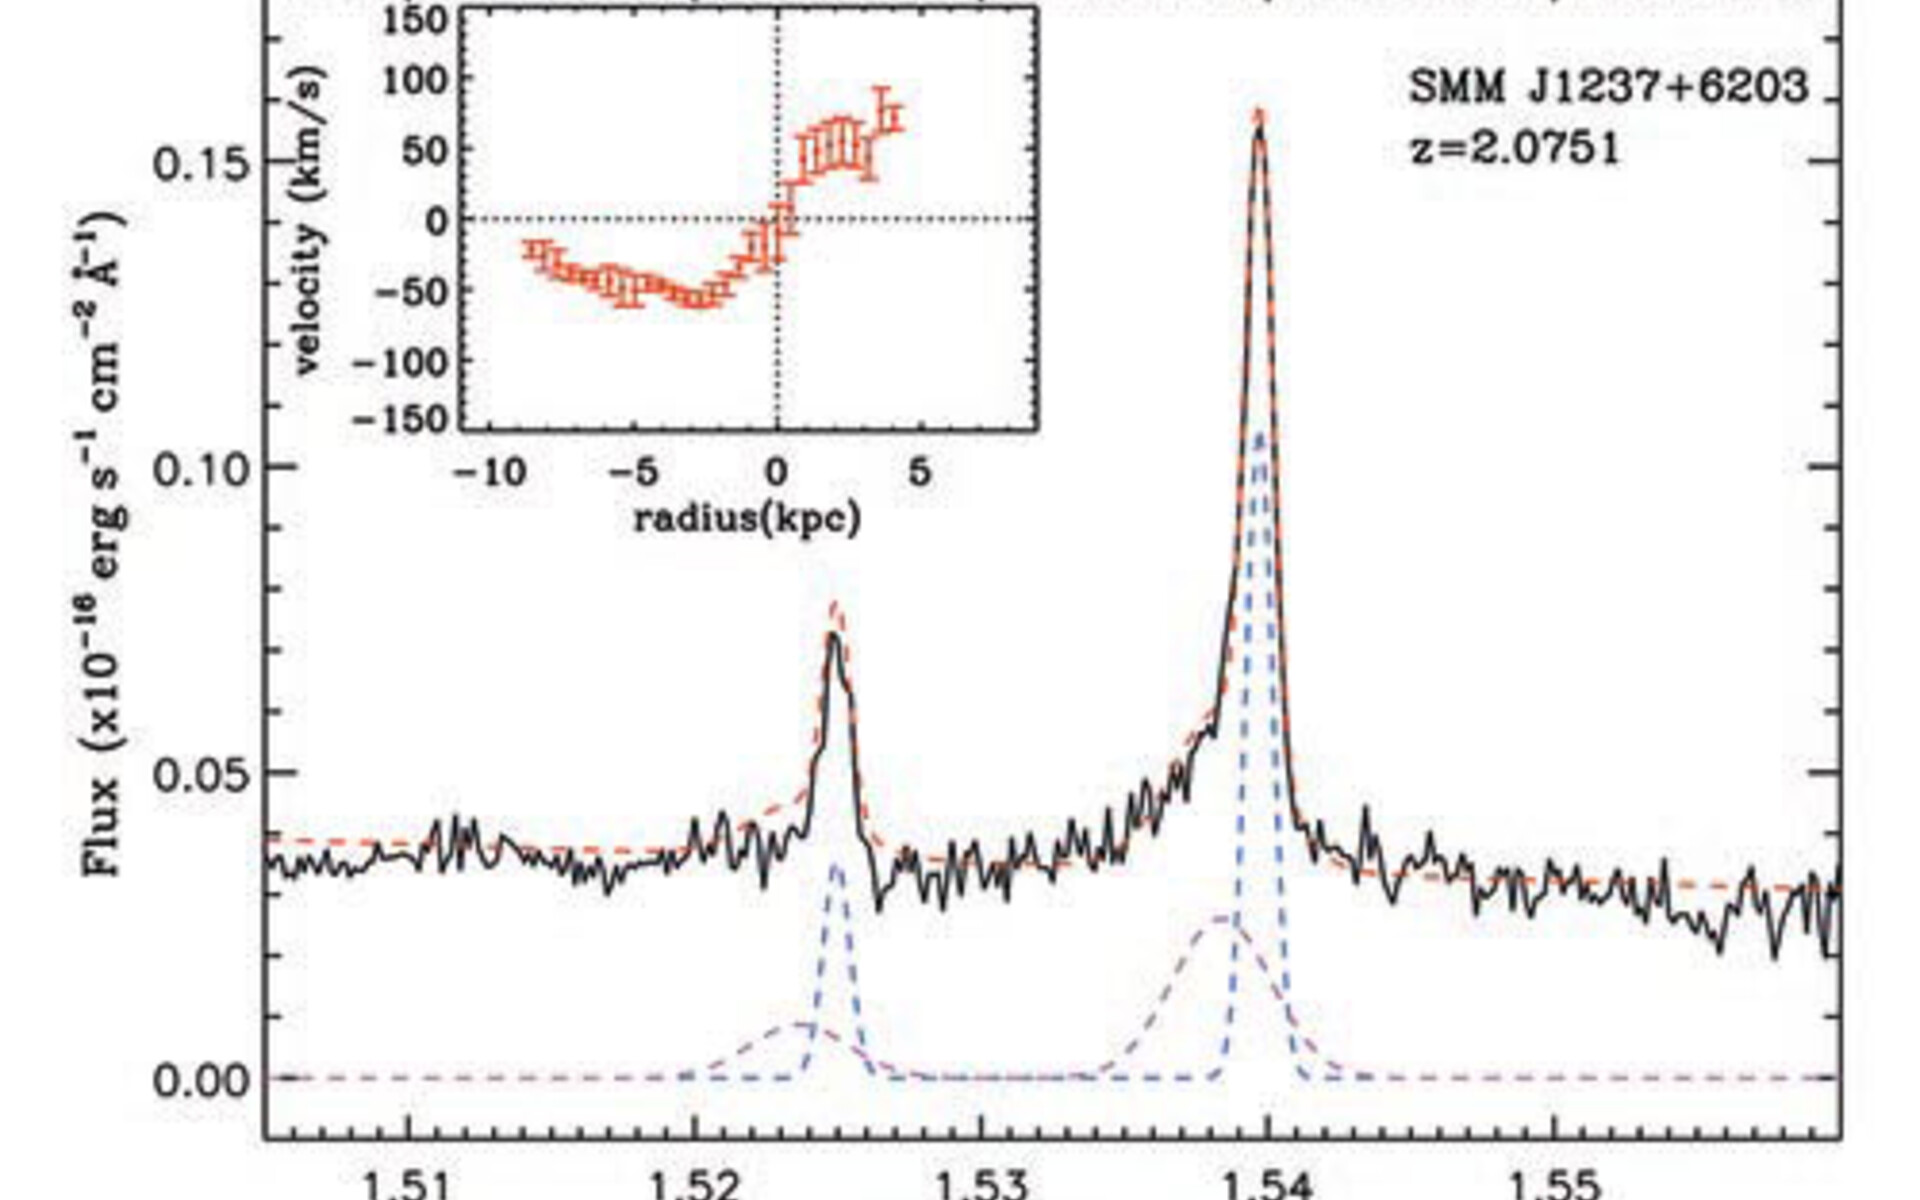
Collapsed one-dimensional NIFS spectrum showing the emission line profiles fitted with both a broad and narrow emission-line component. Inset plot shows the narrow [O III] velocity field.
Credit:International Gemini Observatory/NOIRLab/NSF/AURA
About the Image
| Id: | geminiann10006a |
| Type: | Chart |
| Release date: | March 11, 2010, 4:57 p.m. |
| Related announcements: | geminiann10006 |
| Size: | 500 x 368 px |
About the Object
| Category: | Illustrations |