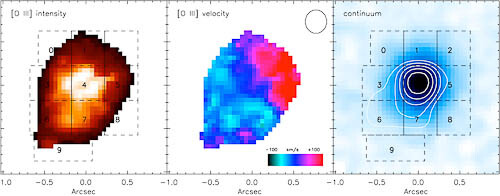
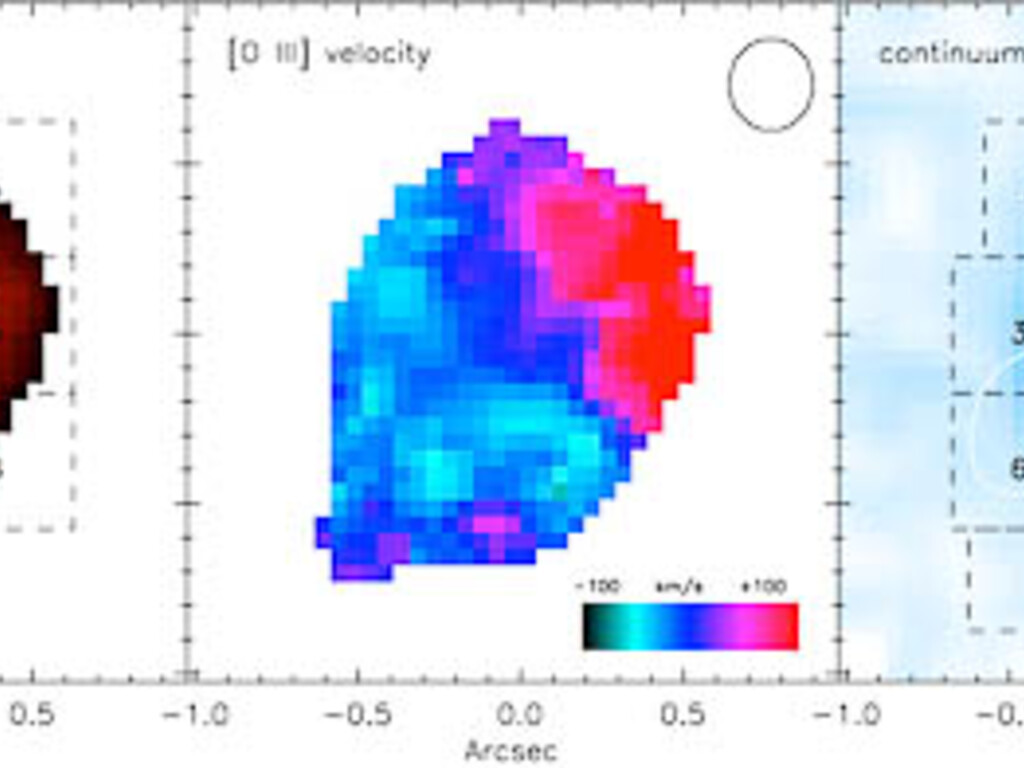
[O III] intensity, narrow [O III] velocity map, and line-free continuum image
![[O III] intensity, narrow [O III] velocity map, and line-free continuum image](/public/media/archives/images/thumb700x/geminiann10006b.jpg)
[O III] intensity (left), narrow [O III] velocity map (middle), and line-free continuum image (right); circle in top right of velocity map denotes the seeing disk size. The contours represent an intensity weighted map of the broad [O III] emission components. The contour in the right panel traces the location and extent of the outflow at a scale of about 4-6 kiloparsecs. The numbered regions of the broad [O III] emission are plotted in geminiann10006c.
Credit:International Gemini Observatory/NOIRLab/NSF/AURA
About the Image
| Id: | geminiann10006b |
| Type: | Collage |
| Release date: | March 11, 2010, 4:57 p.m. |
| Related announcements: | geminiann10006 |
| Size: | 500 x 196 px |
About the Object
| Category: | Illustrations |