Spectral light curves with the central wavelengths marked and a linear trend in time removed
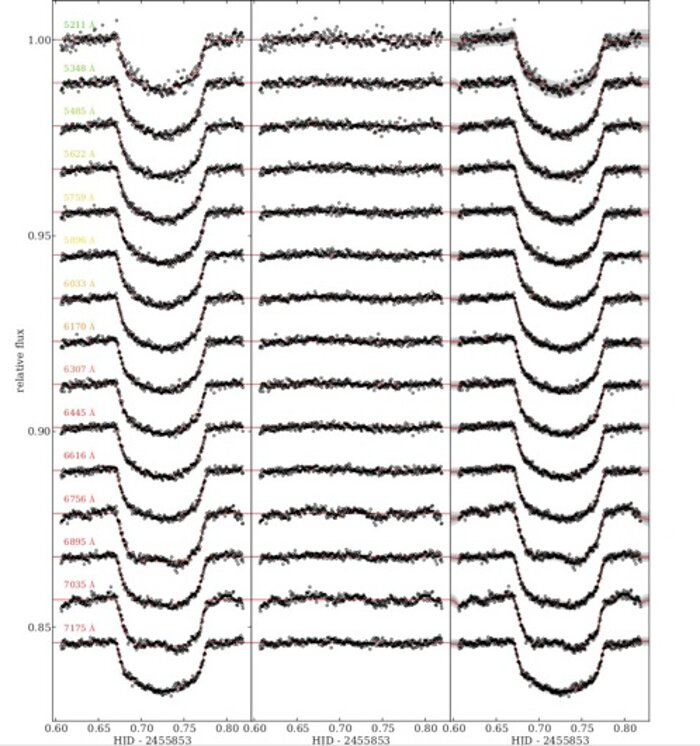
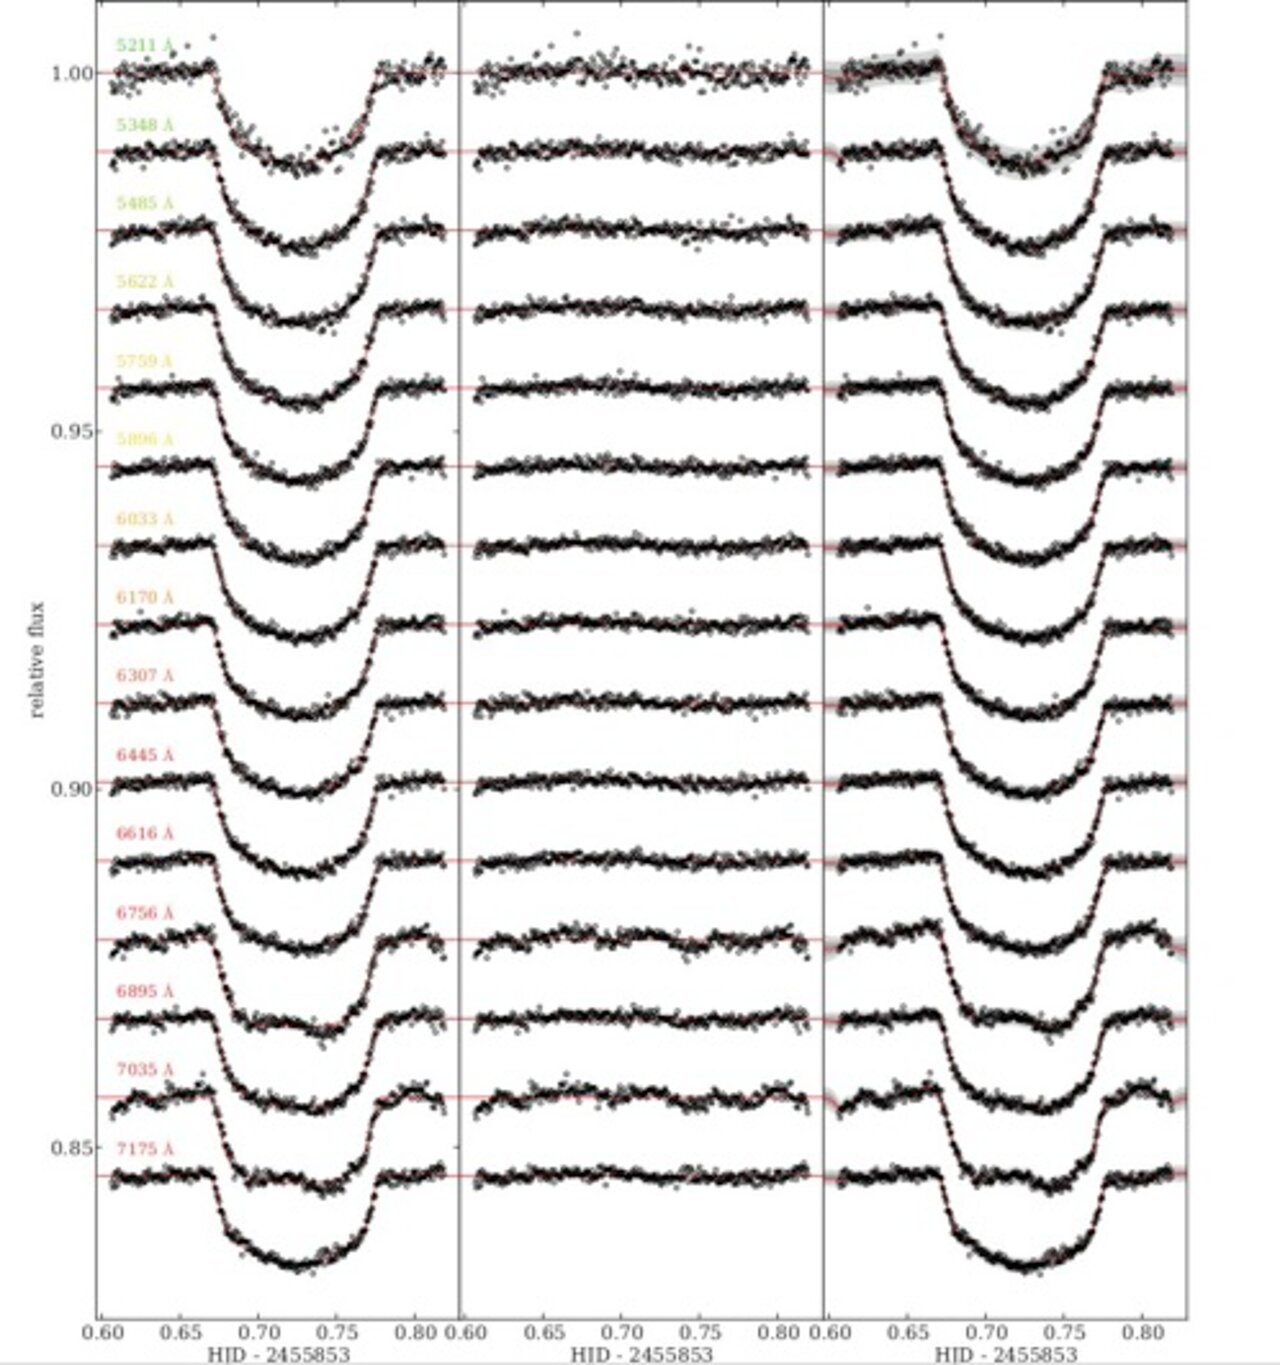
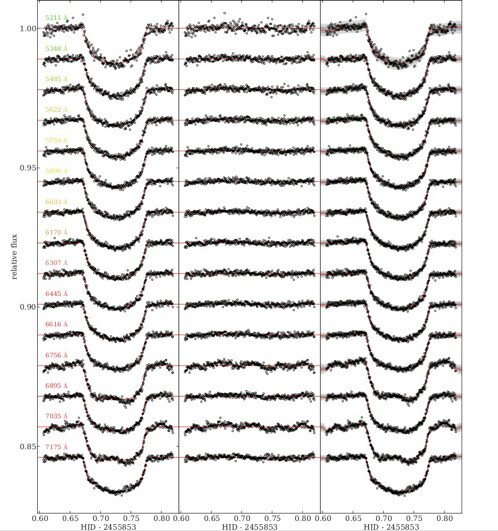
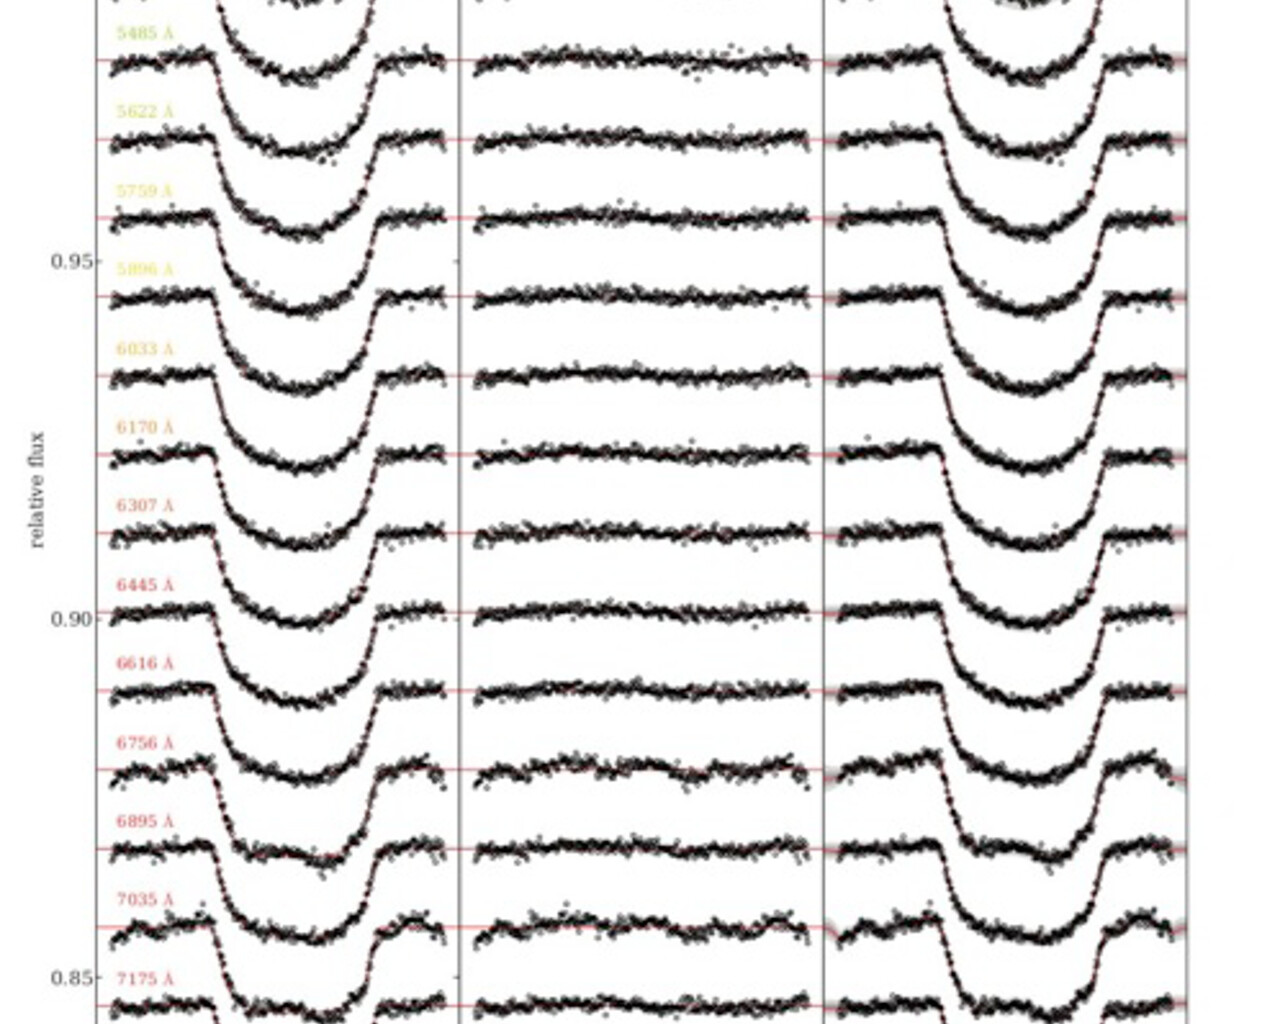
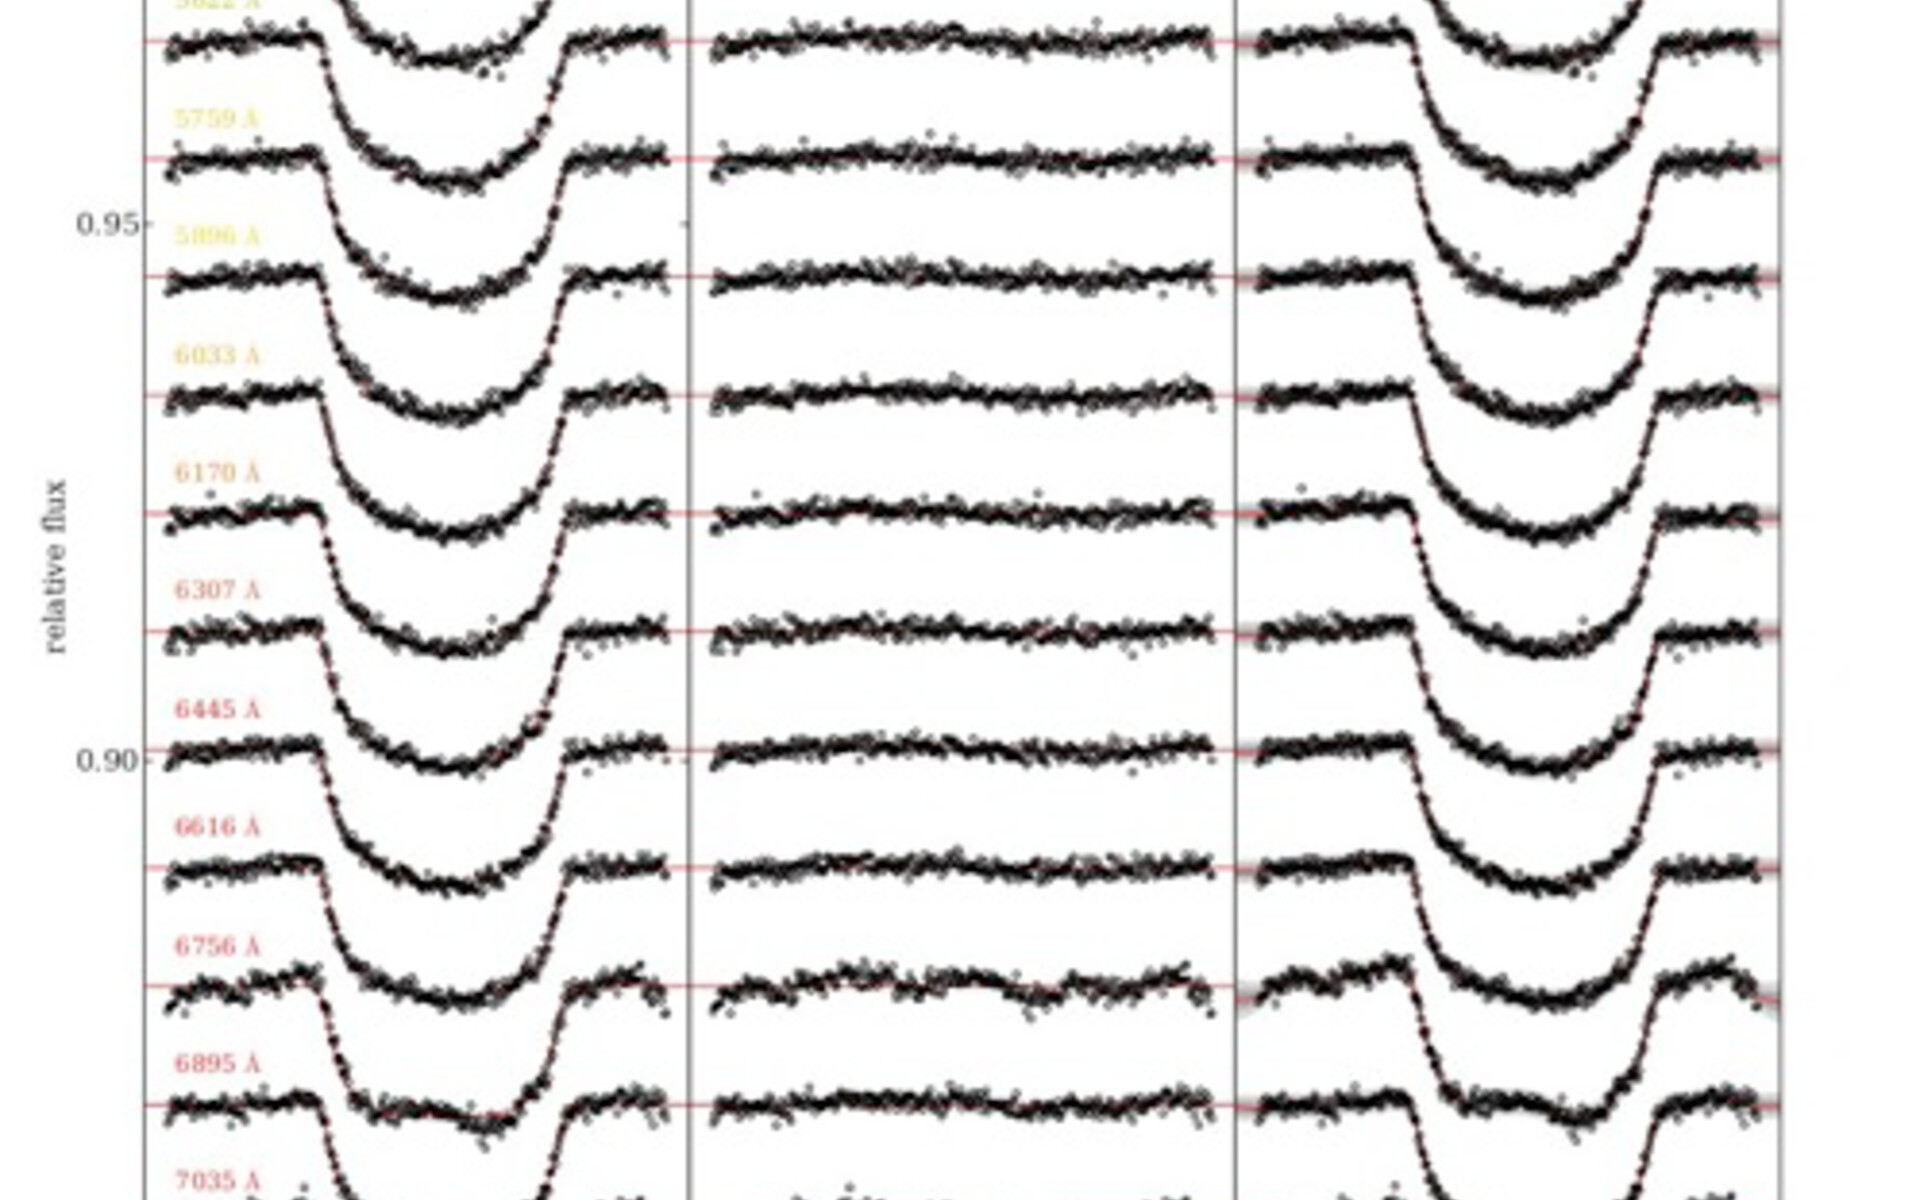
Spectral light curves with the central wavelengths marked and a linear trend in time removed. Left panel: Light curves fitted with the simple white noise model. Middle panel: Residuals from the white noise fits. Right panel: Identical light curves as left panel with their best fit Gaussian Processing (GP) model in red. The grey shading represents the 1 and 2 σ limits of the GP model (including white noise).
Credit:International Gemini Observatory/NOIRLab/NSF/AURA
About the Image
| Id: | geminiann12014a |
| Type: | Chart |
| Release date: | Nov. 19, 2012, 2:59 p.m. |
| Related announcements: | geminiann12014 |
| Size: | 498 x 531 px |
About the Object
| Category: | Illustrations |