Model spectrum fit
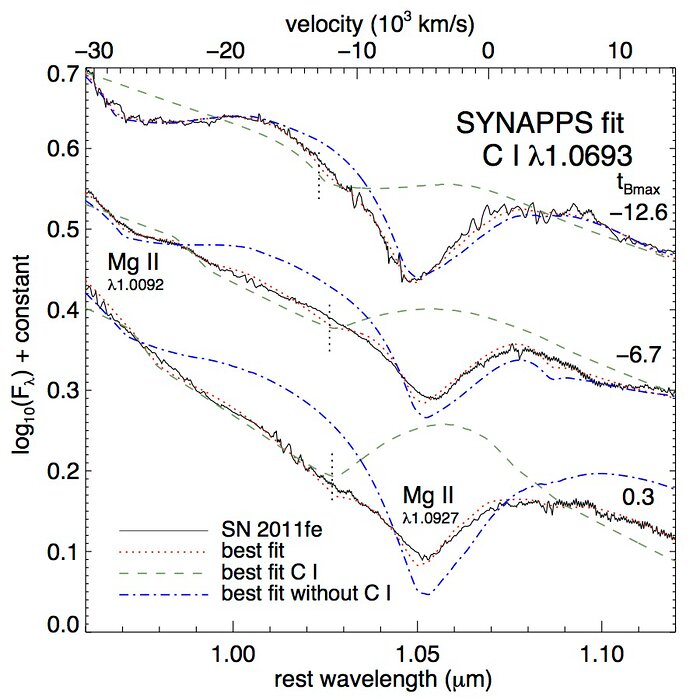
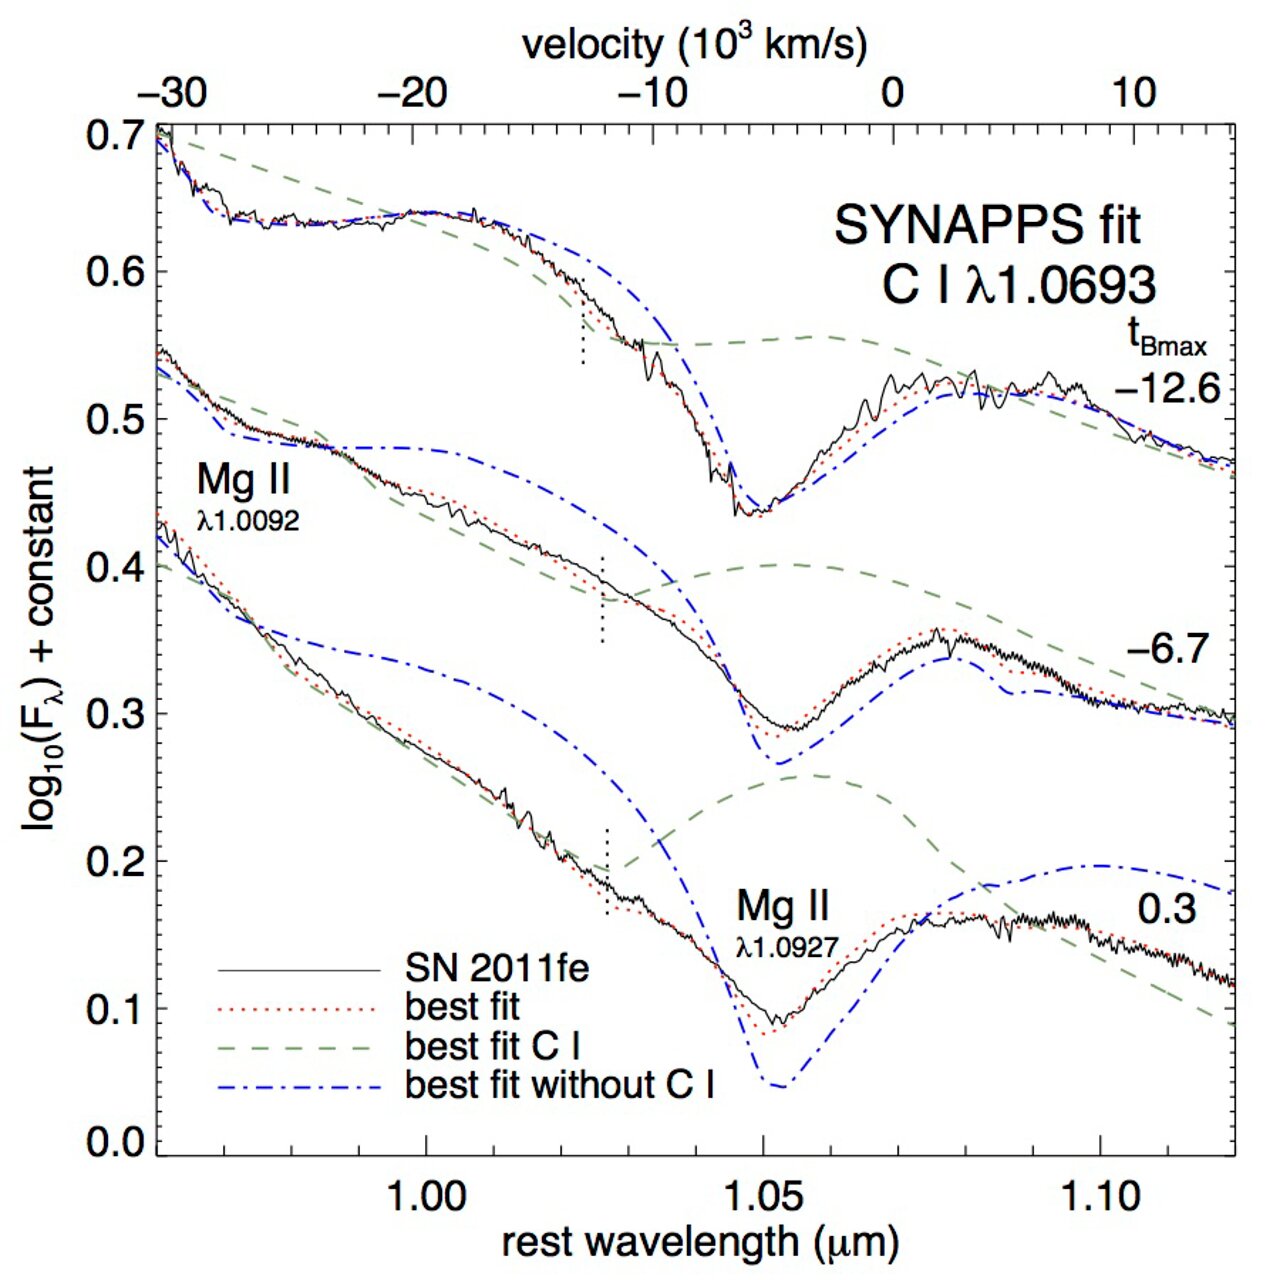
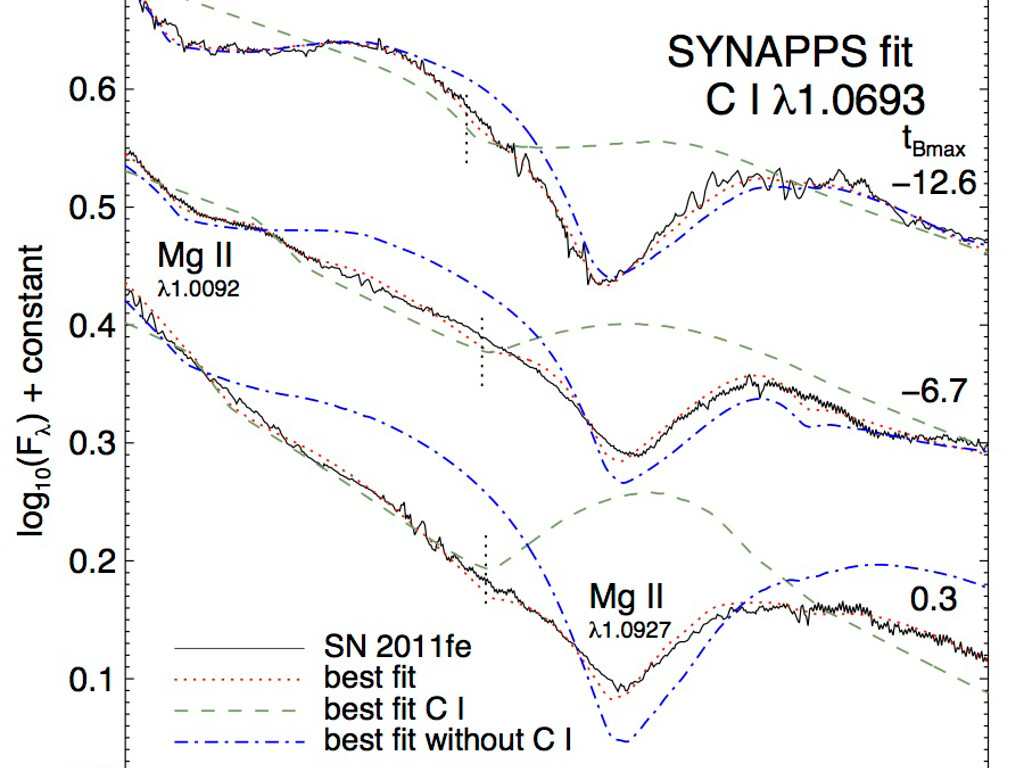
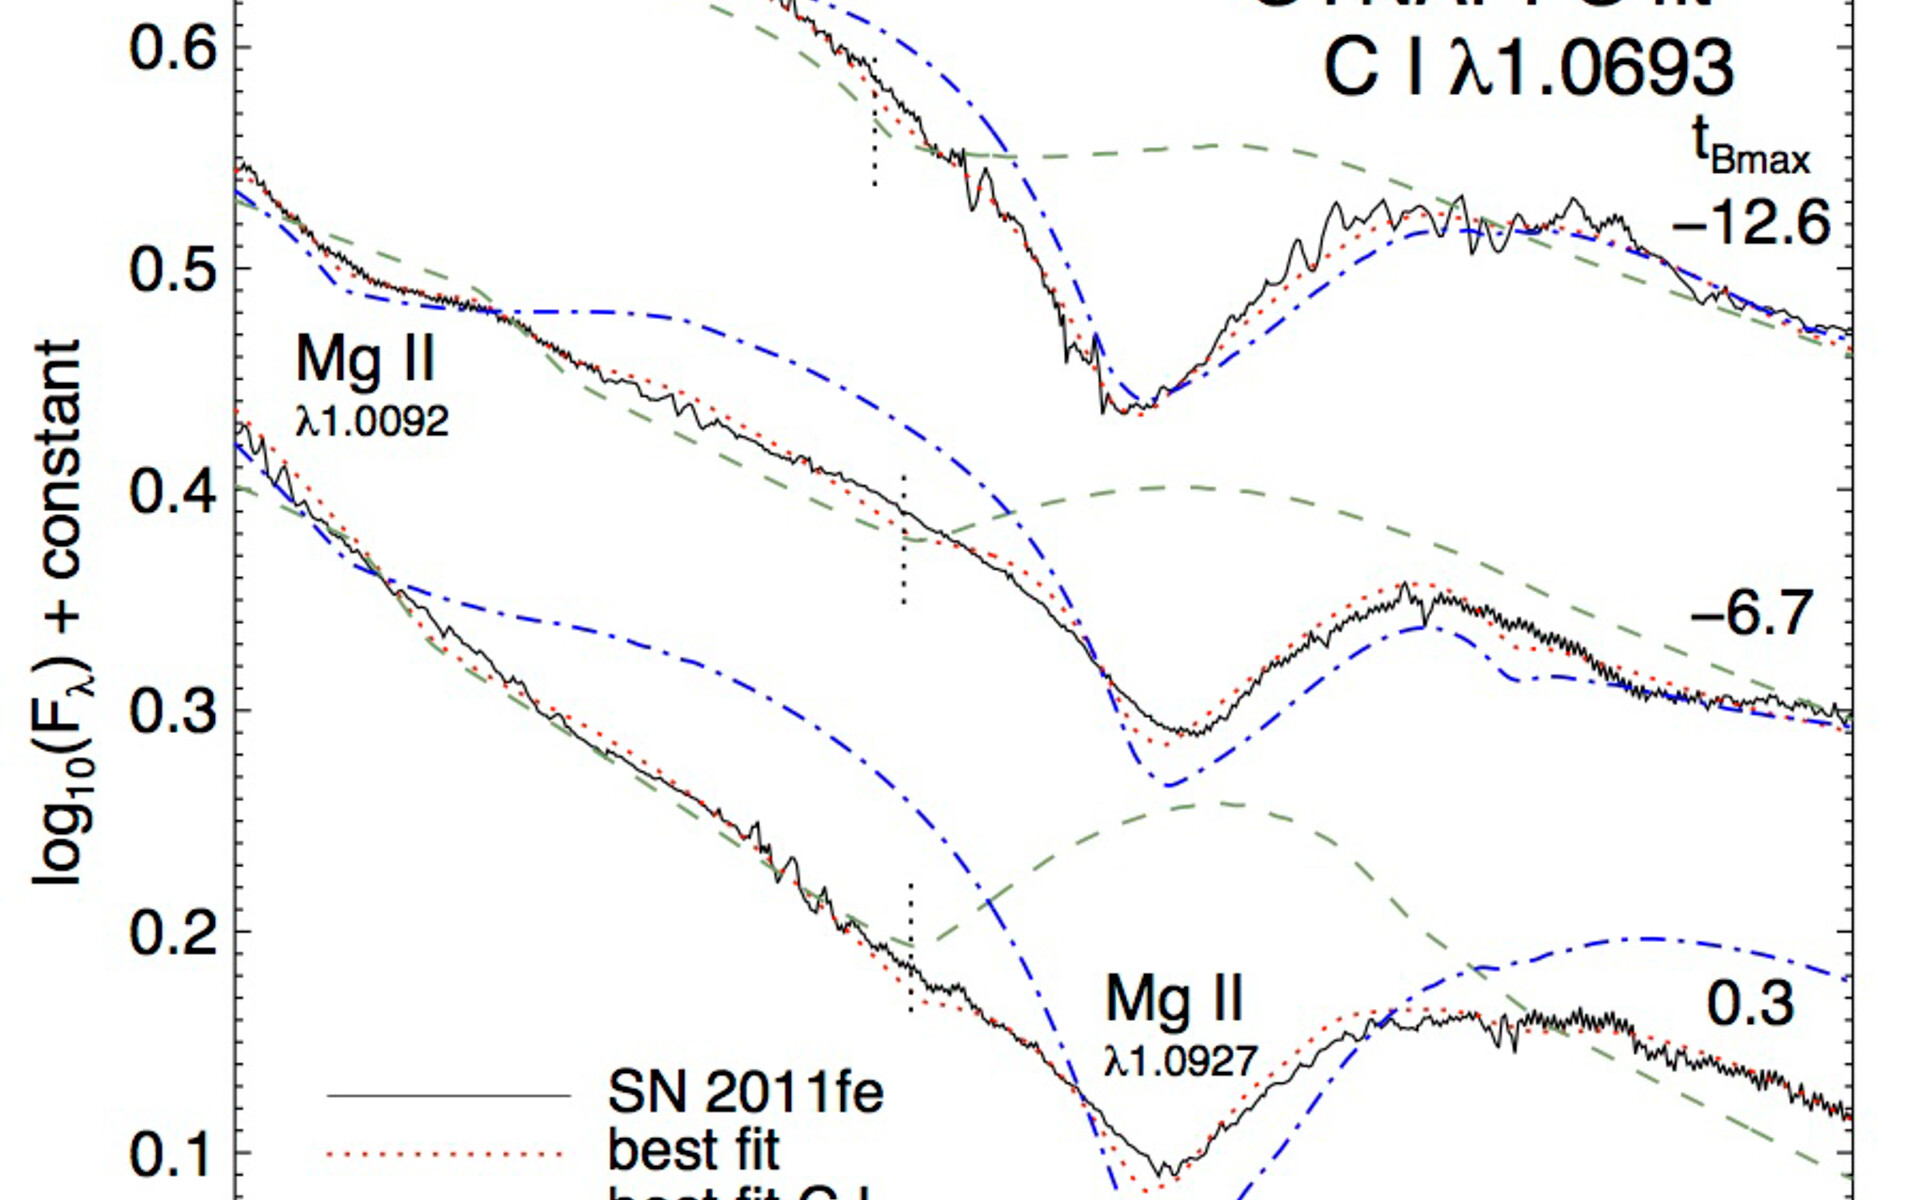
Model spectrum fit to the GNIRS spectra of SN 2011fe around the near-infrared carbon line. The observed spectra are plotted as solid black curves. The best-fit model spectra are plotted as follows: with all ions, with carbon only, and with all ions except carbon. These are plotted as red dotted, green dashed, and blue dash-dotted curves, respectively. The vertical dotted lines mark the location of the best-fit carbon velocity. The phases relative to maximum light are noted.
Credit:NOIRLab/Gemini Observatory/AURA
About the Image
| Id: | geminiann13004c |
| Type: | Chart |
| Release date: | Feb. 14, 2013, 2:23 p.m. |
| Related announcements: | geminiann13004 |
| Size: | 900 x 900 px |