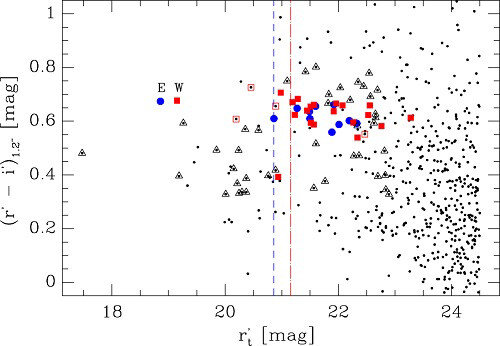
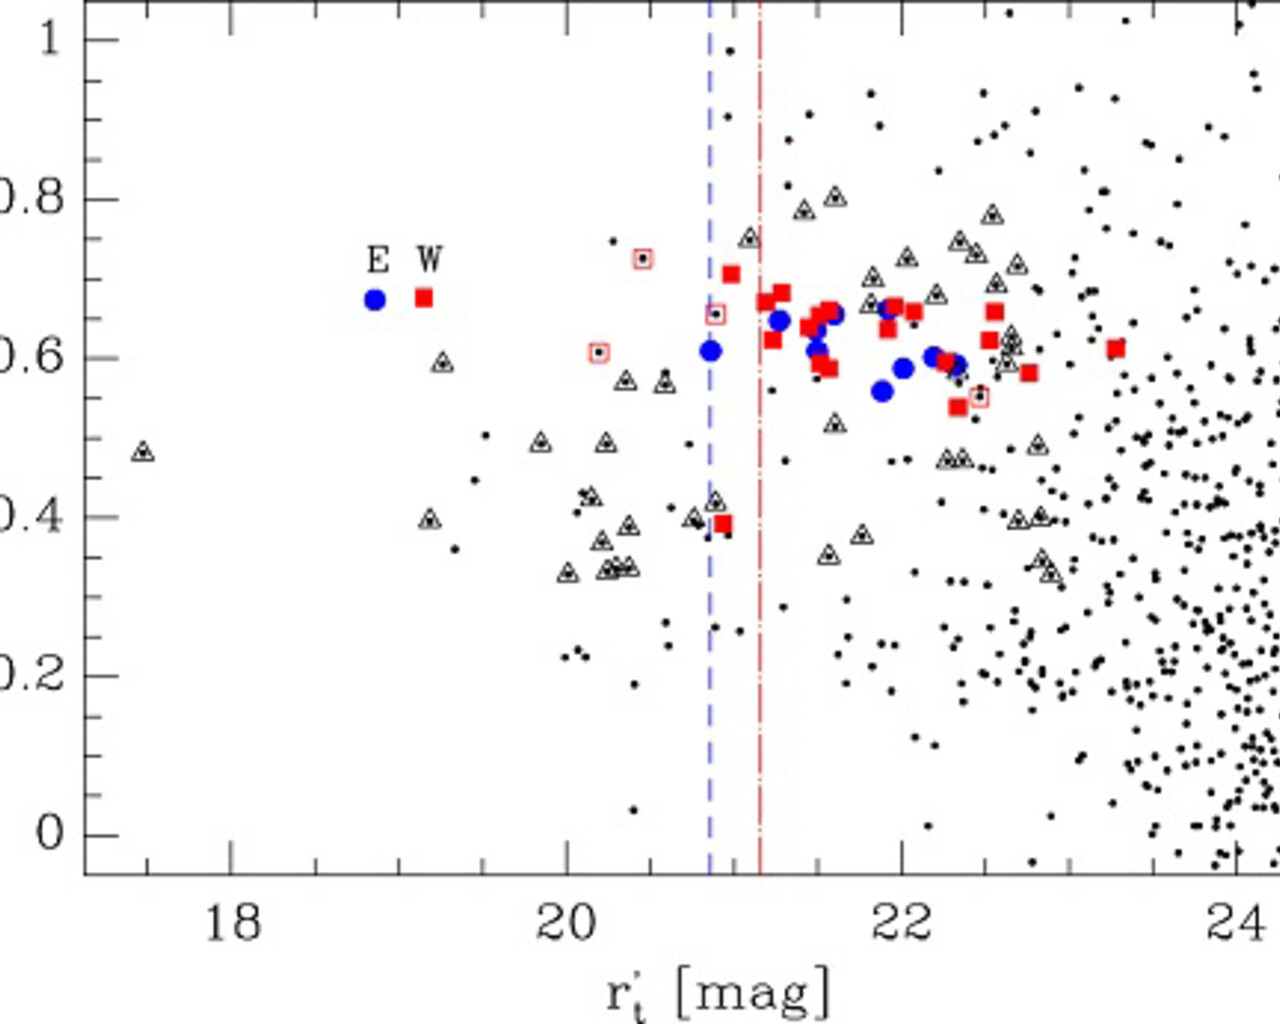
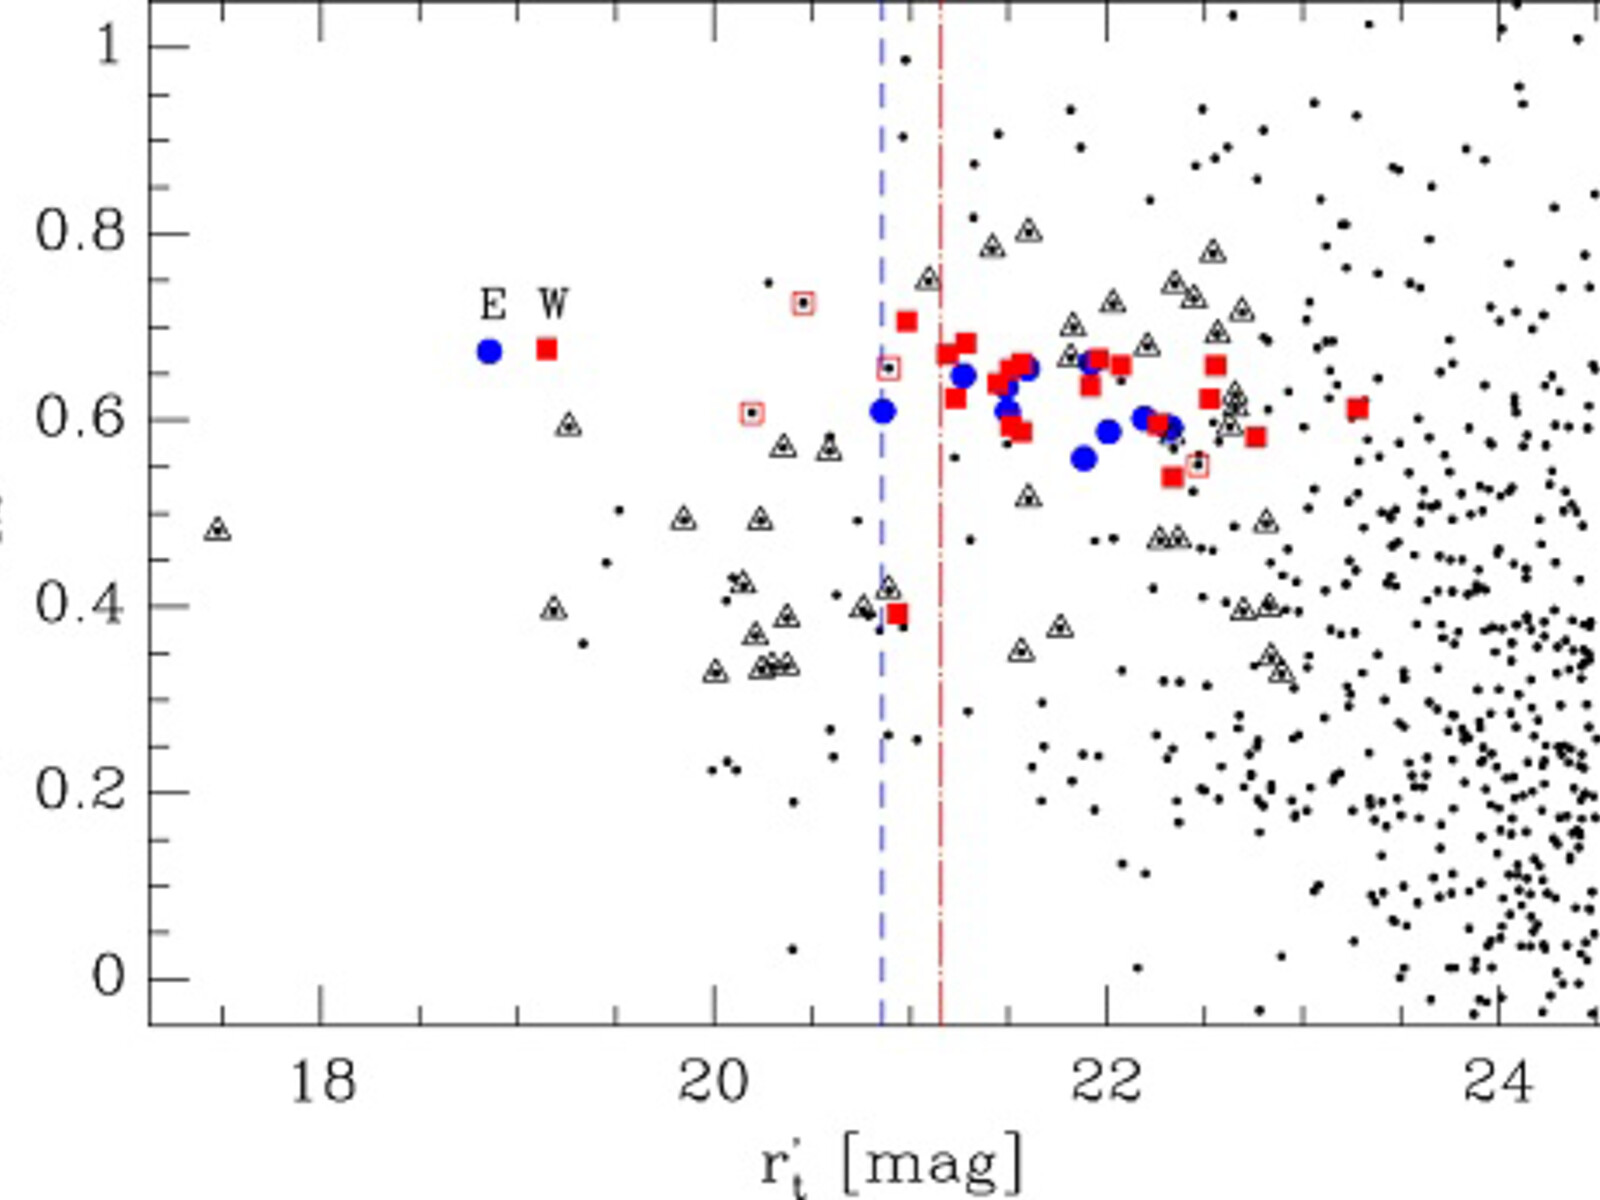
Color–magnitude diagram of all galaxies detected in the GMOS images

Color–magnitude diagram of all galaxies detected in the GMOS images with r' brighter than 24.5 mag (595 galaxies, black dots). Blue circles and red squares are the spectroscopically confirmed members of the G1 and G2 groups respectively, with filled and open symbols representing which of these galaxies lie inside and outside of 0.5 r200 of the group. Red short dash and blue long dash vertical lines represent a two magnitude gap from the E and W eye galaxies, respectively. The black triangles represent spectroscopically confirmed background and foreground galaxies, while black dots represent objects without spectroscopic redshifts. The two central galaxies of the groups, SDSS J103843.58+484917.7 and SDSS J103842.68+484920.2 (the "eyes" of the Cheshire Cat) are represented by a letter (E and W) in the CMD.
Credit:International Gemini Observatory/NOIRLab/NSF/AURA
About the Image
| Id: | geminiann15015b |
| Type: | Chart |
| Release date: | Nov. 23, 2015, 12:24 p.m. |
| Related announcements: | geminiann15015 |
| Size: | 500 x 346 px |
About the Object
| Category: | Illustrations |