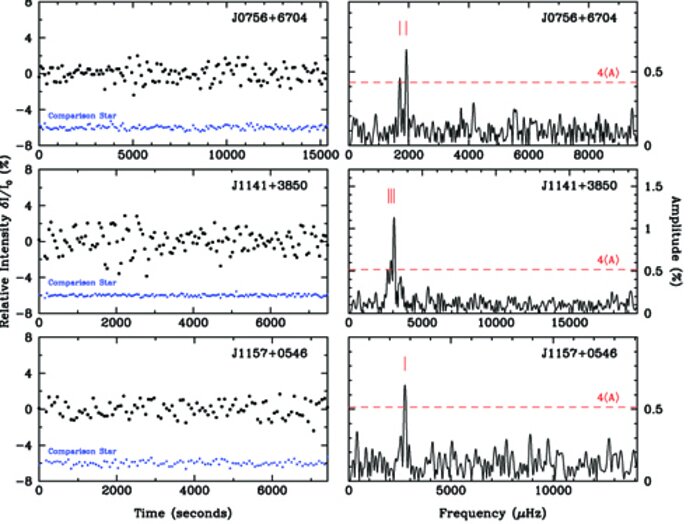
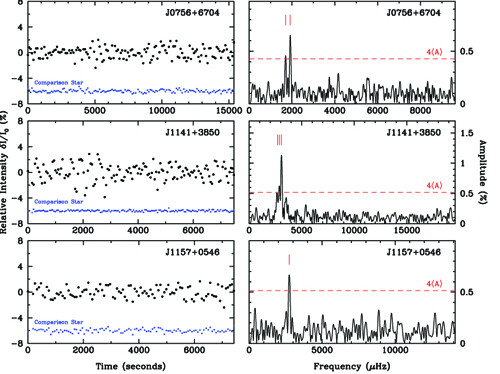
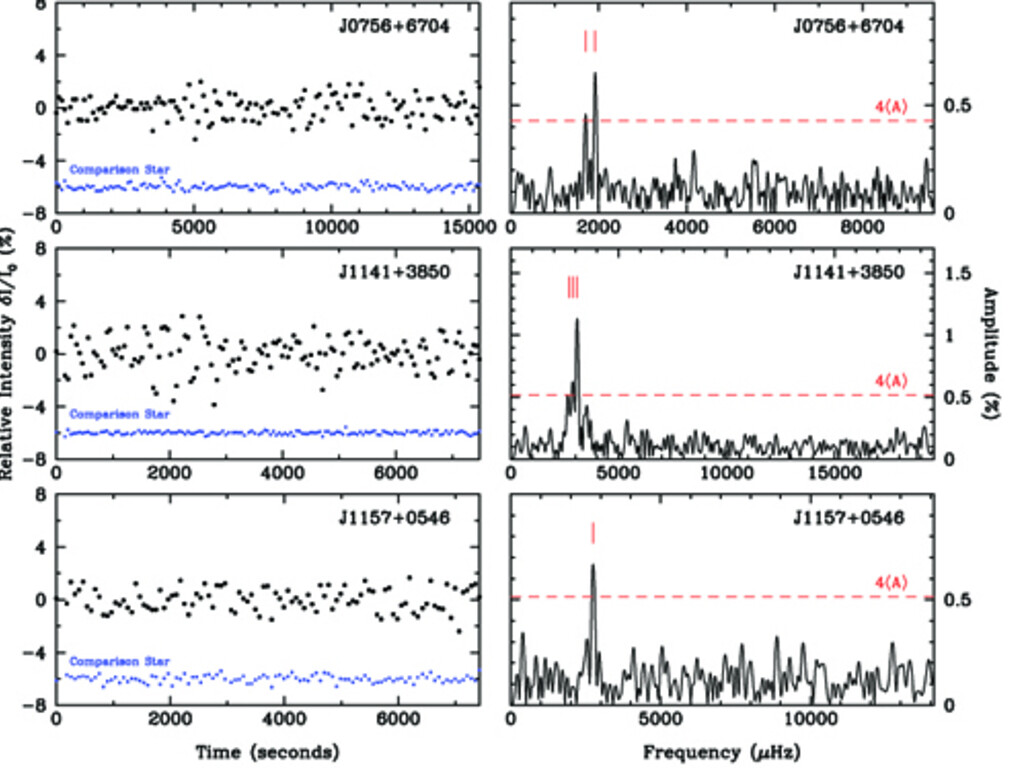
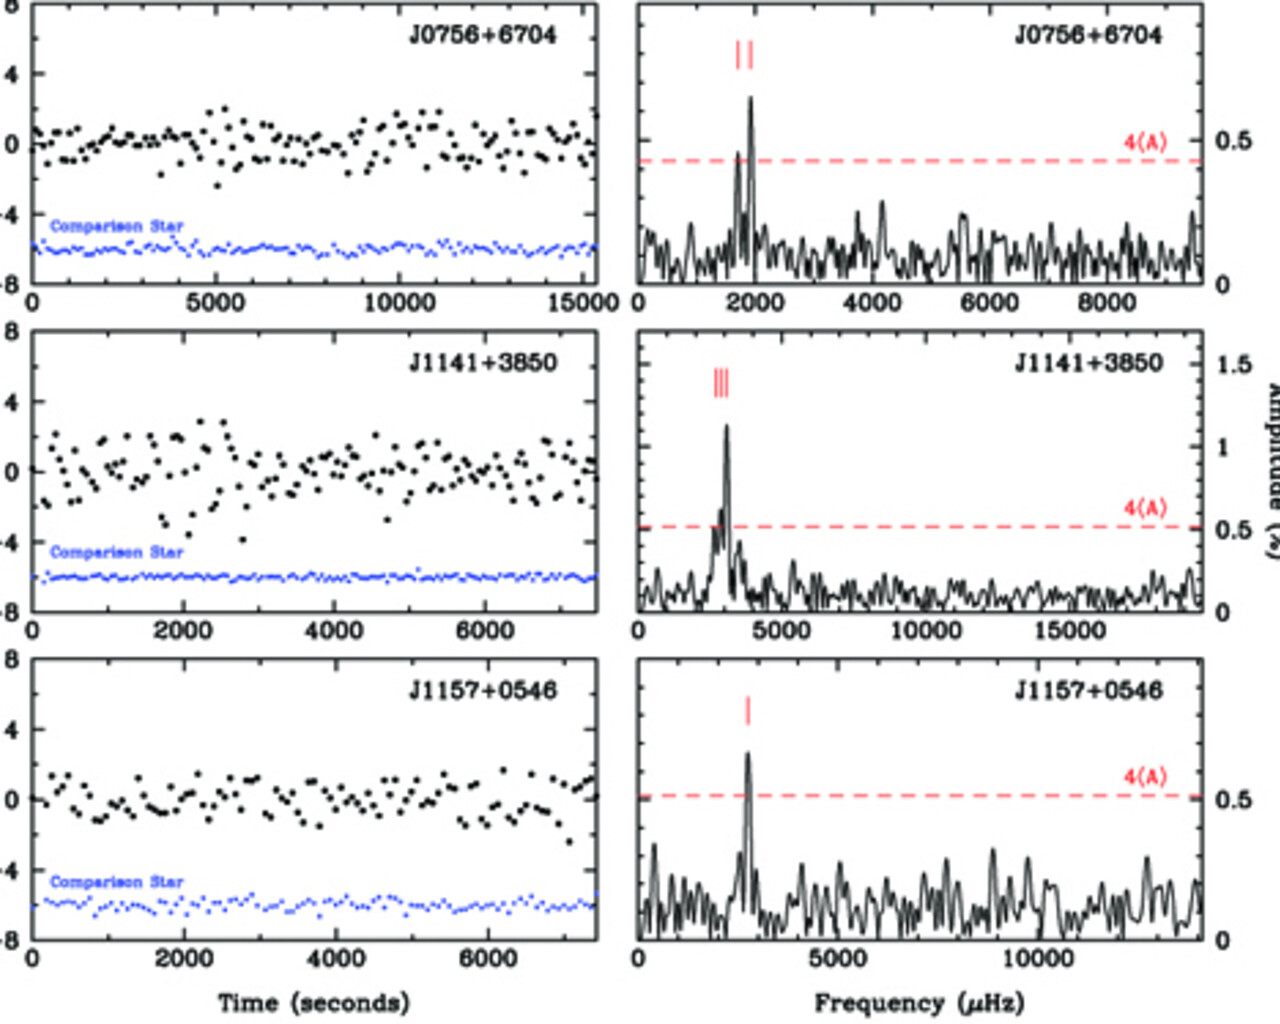
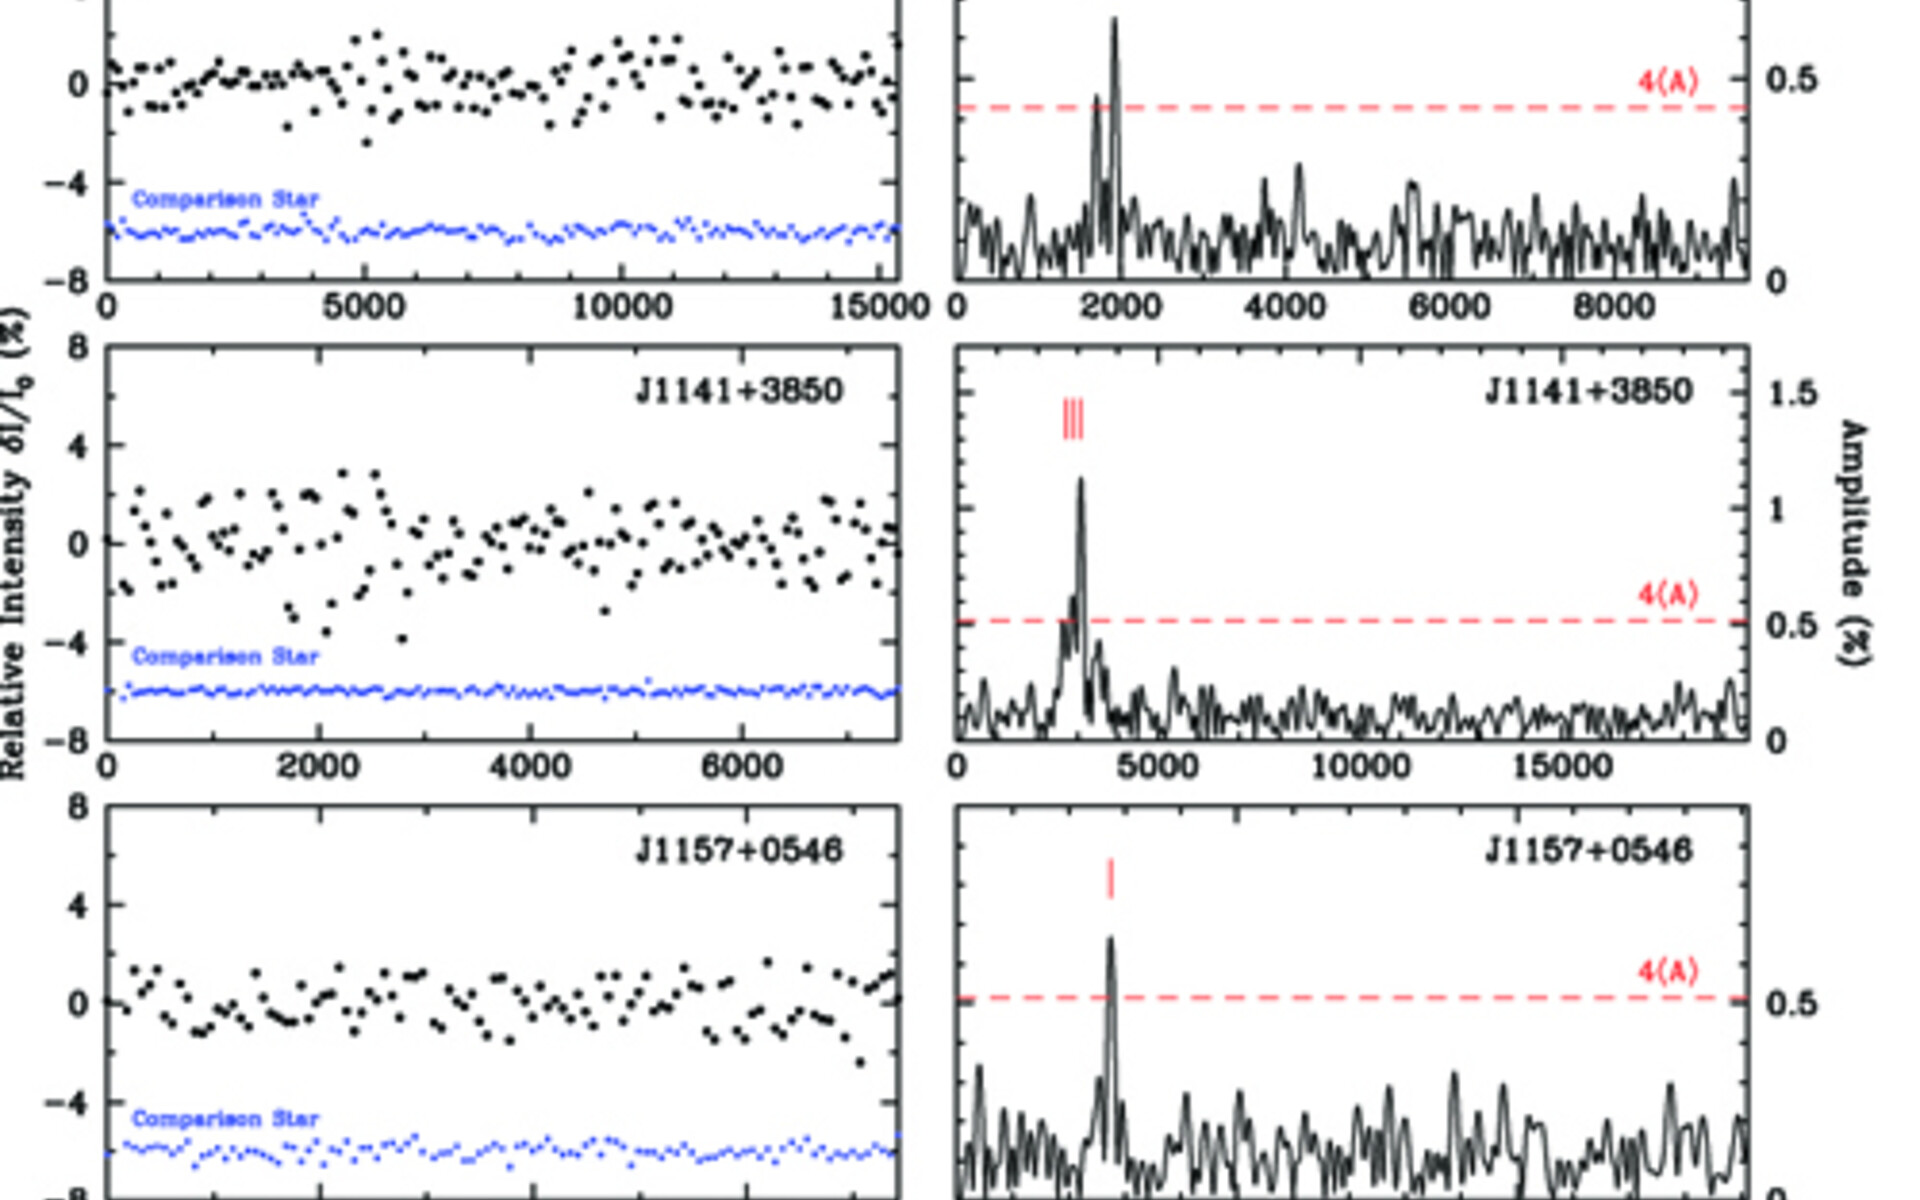
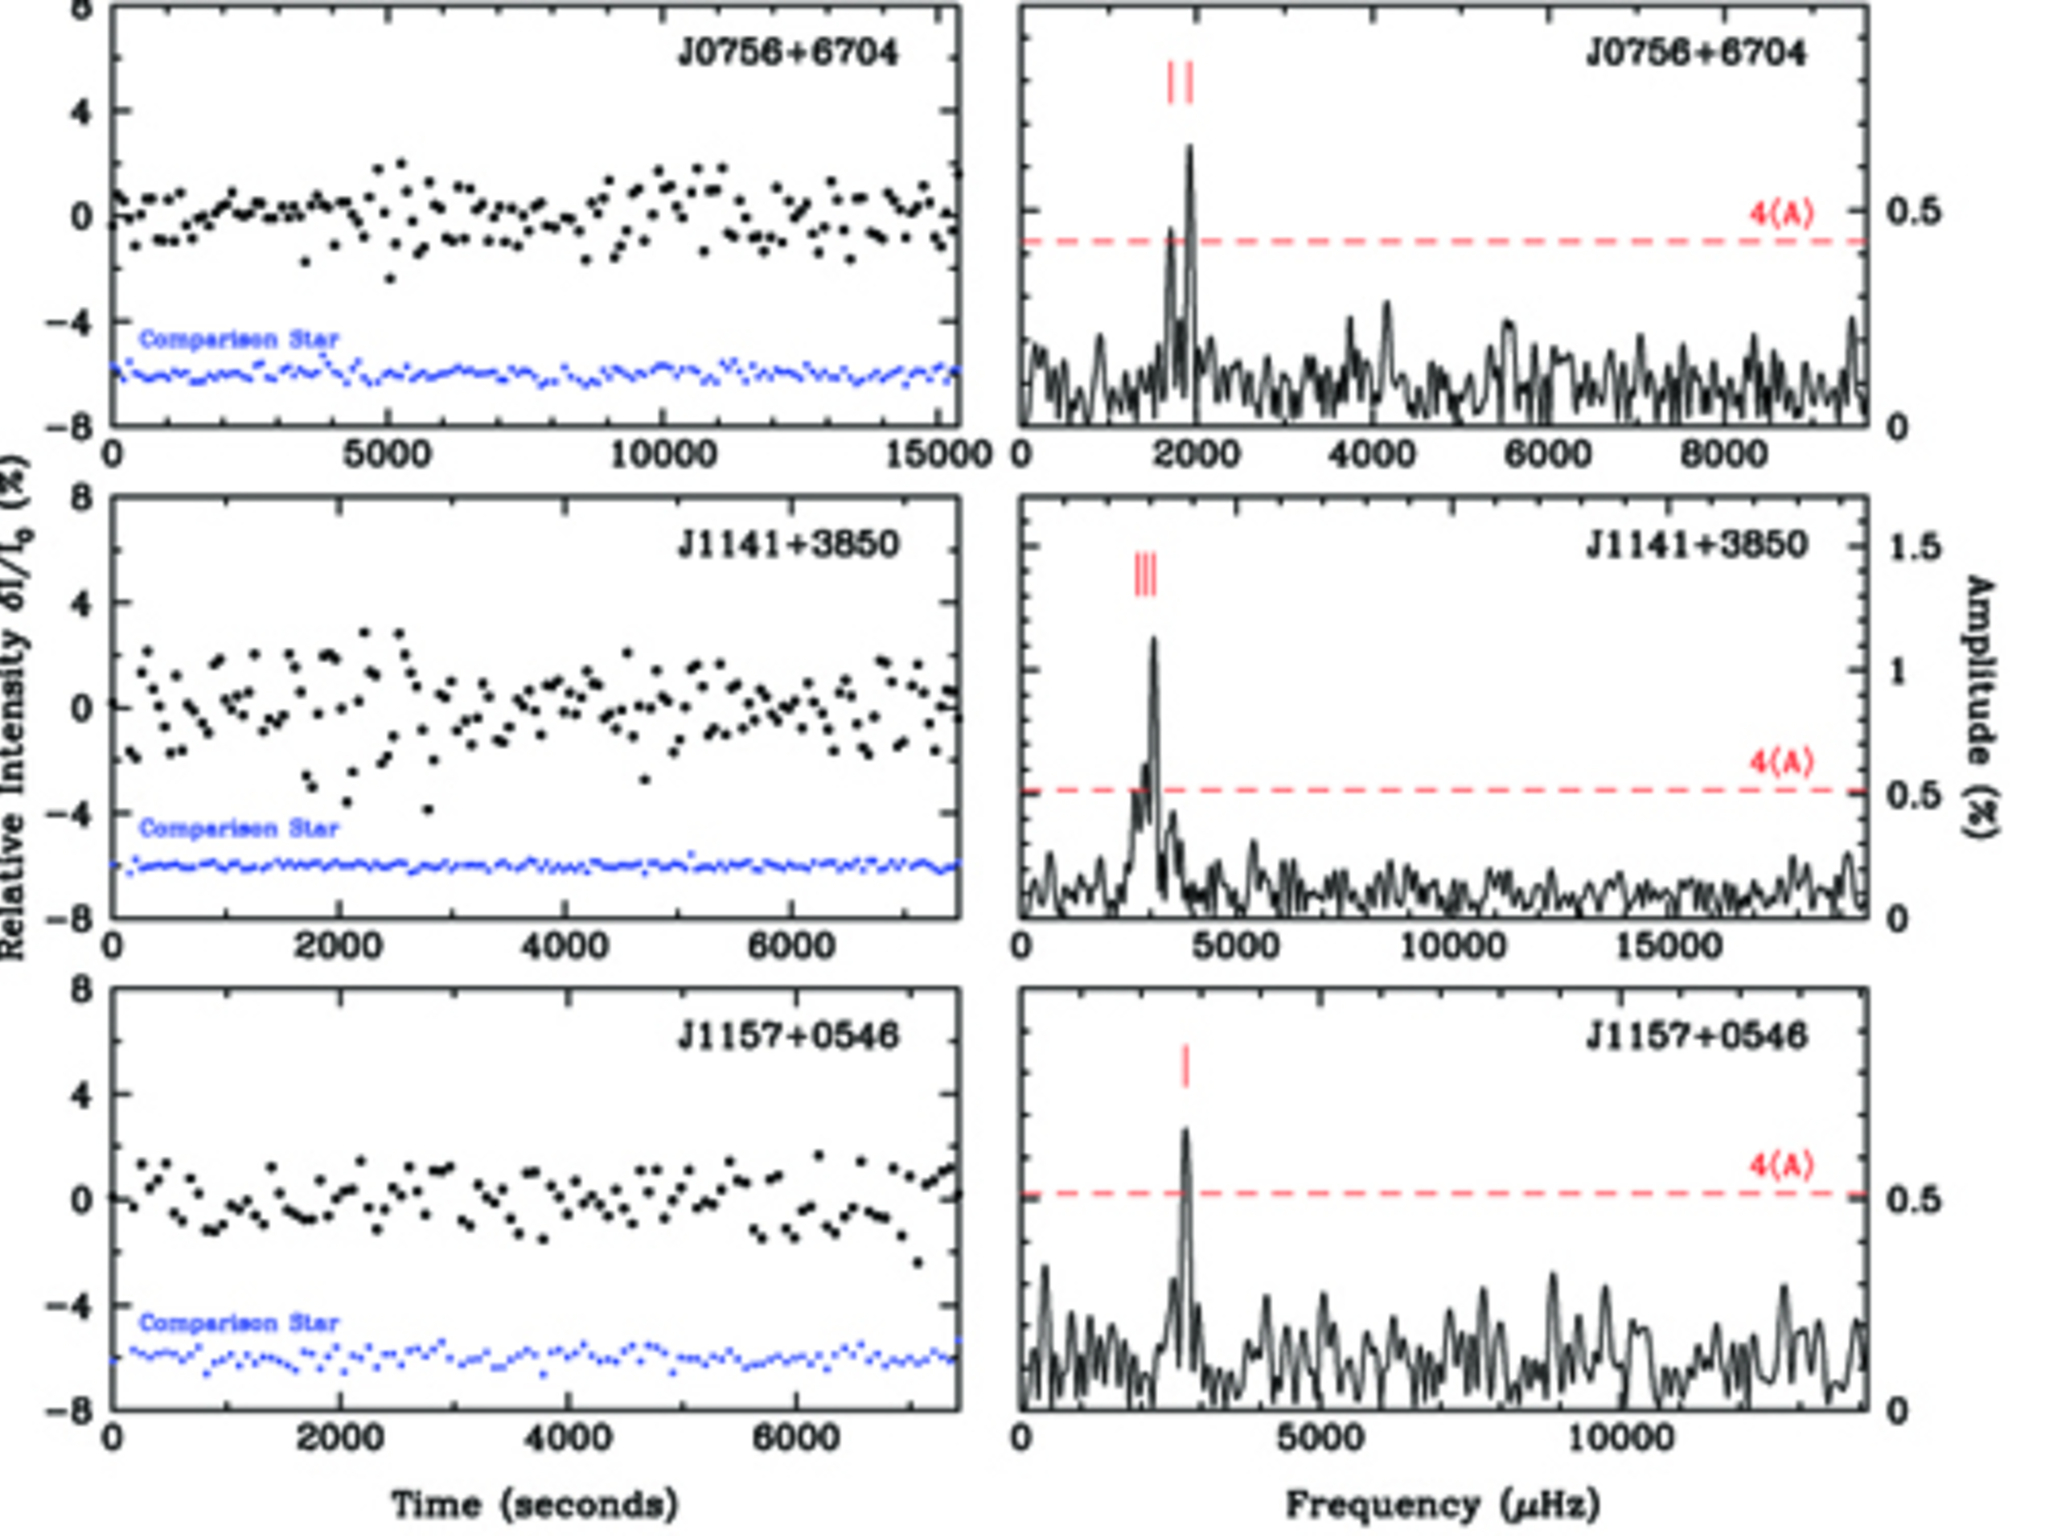
Light curves and Fourier amplitude spectra for the three new pulsating low-mass white dwarfs
Light curves (left) and Fourier amplitude spectra (right) for the three new pulsating low-mass white dwarfs. The red tick marks denote the significant frequencies which lie above the detection threshold of four times the average noise level.
Credit:International Gemini Observatory/NOIRLab/NSF/AURA
About the Image
| Id: | geminiann16008a |
| Type: | Chart |
| Release date: | May 11, 2016, 1:02 p.m. |
| Related announcements: | geminiann16008 |
| Size: | 500 x 374 px |
About the Object
| Category: | Illustrations |