Revolving flows inside the Sun, as seen by GONG.

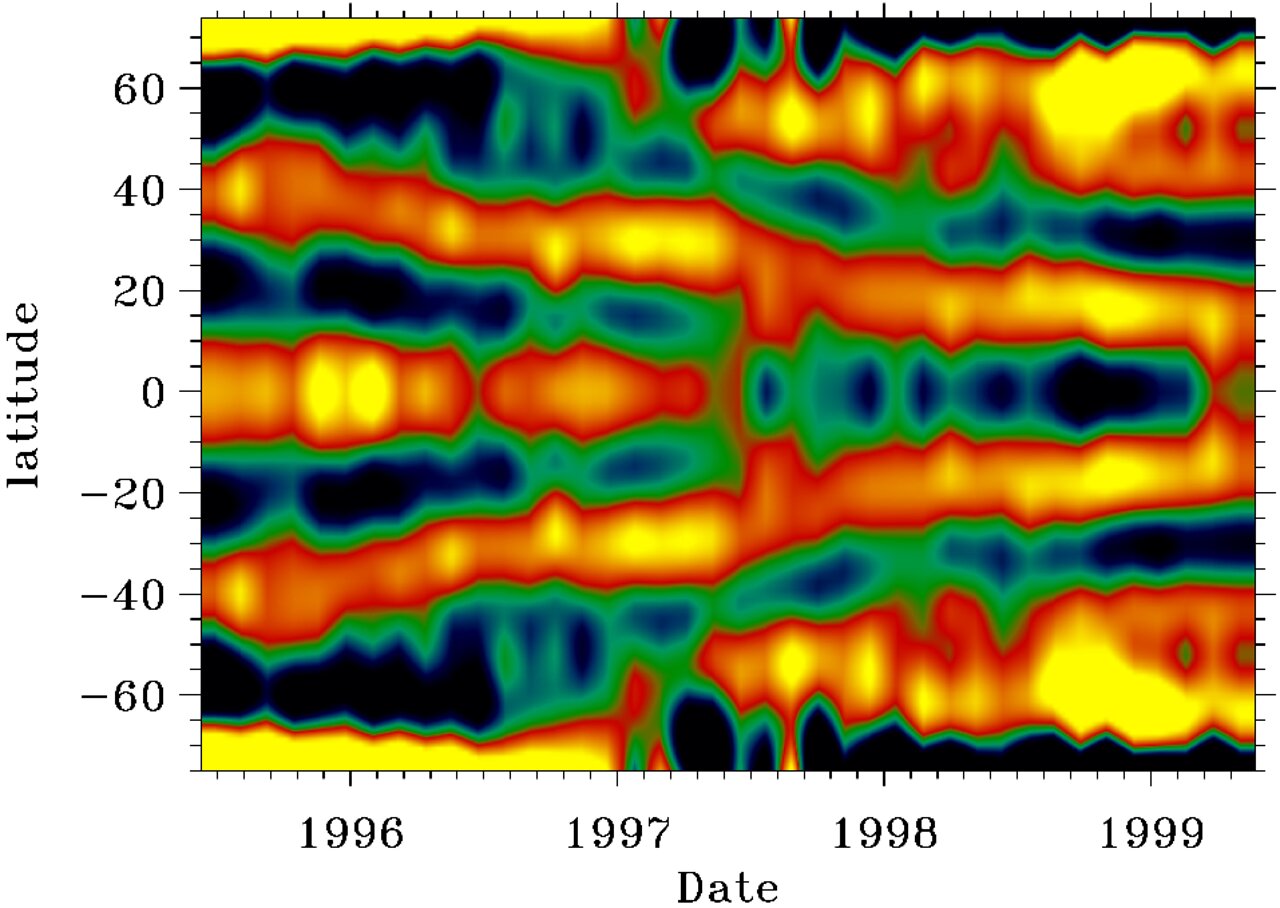
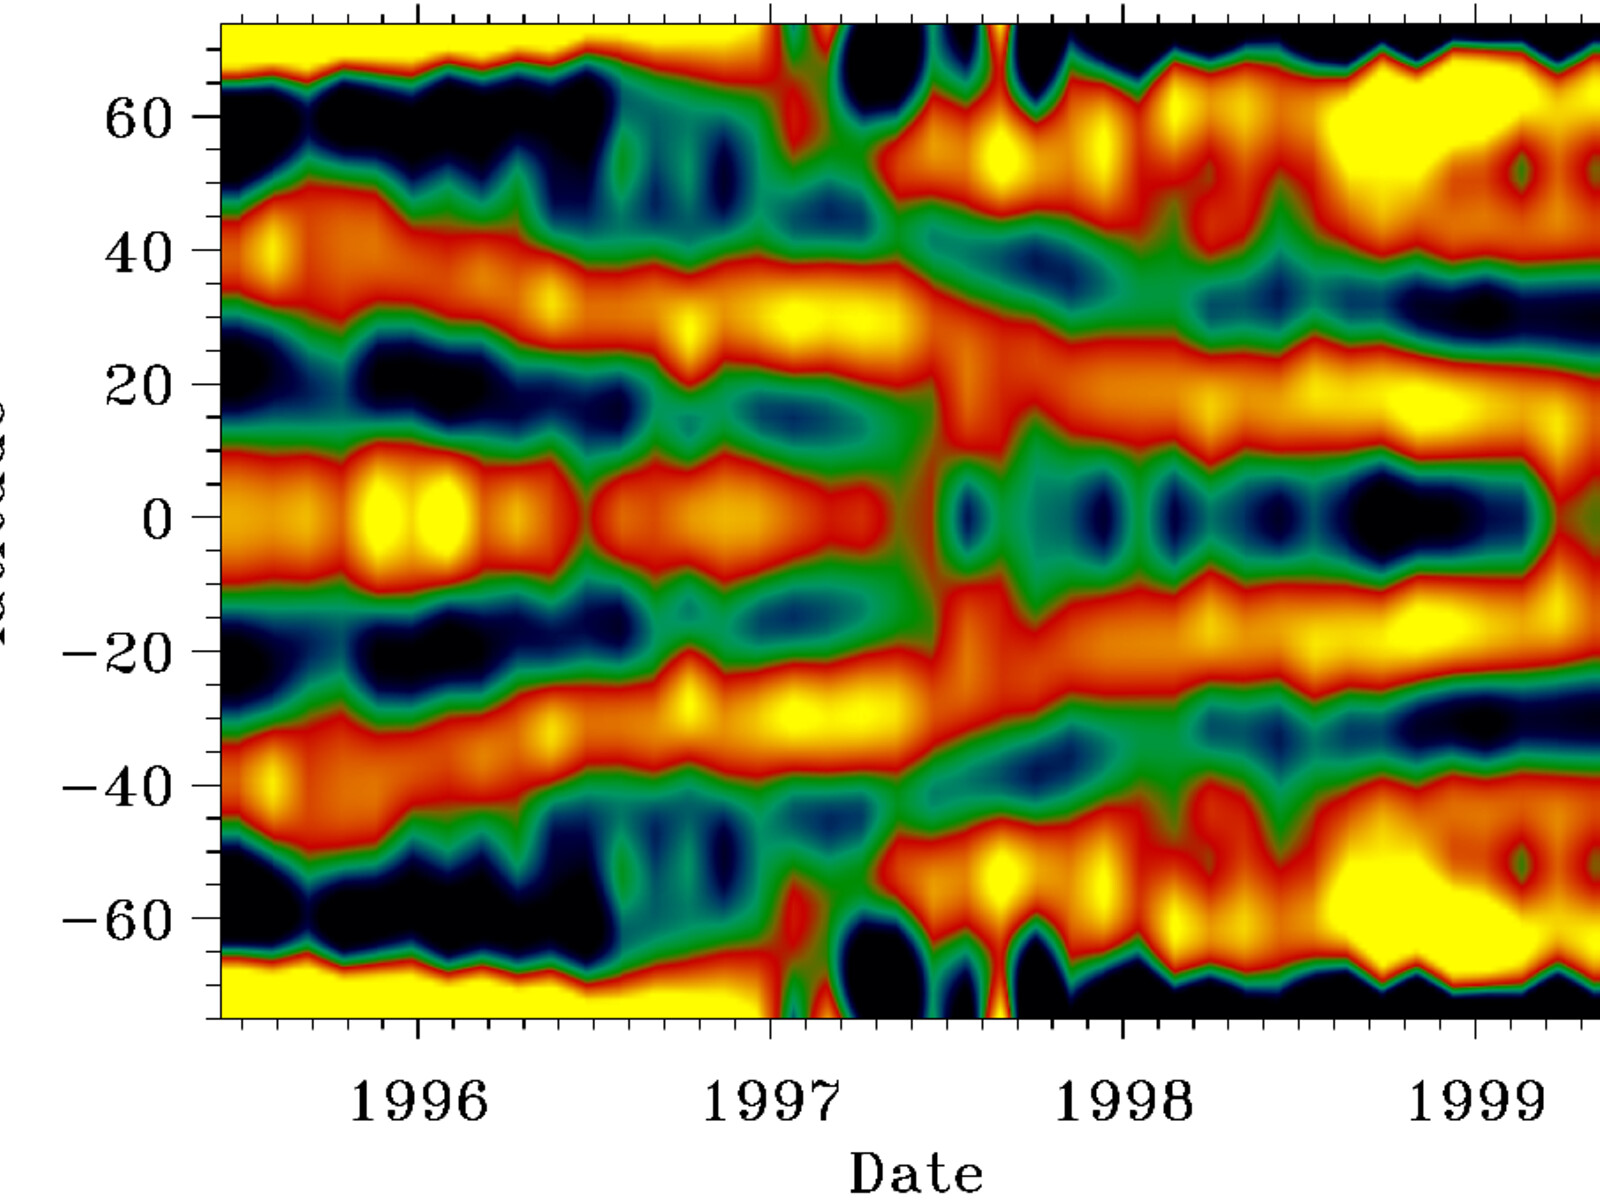
This figure shows the time variation of solar rotation, as derived from GONG data, with date horizontally and solar latitude vertically. Thirty-nine overlapping 108-day intervals, covering 1476 days from the end of the previous solar cycle to the rising phase of the current one, were analyzed using the usual GONG algorithms, and rotational splitting coefficients were fitted to the frequencies. The coefficients were then inverted to give a rotation profile for each interval. The mean rotation rate over the entire time span was found for each radius and latitude, and subtracted from the value for each point. The figure shows the residual rotation rate at 1% of the solar radius, 7 Mm below the surface. Bands of faster and slower rotation converging towards the equator are clearly visible, and they are consistent with the surface Doppler measurements of the so-called torsional oscillation. Magnetic activity appears along the poleward edge of the more rapid flows. There is evidence from the helioseismic data that these flow bands extend tens of megameters below the surface, well into the Convection Zone, and also that significant variations occur deeper down, at the interface between the Convection Zone and the rigidly-rotating interior of the Sun. See the article in the NOAO March 2000 newsletter.
Credit:Rachel Howe, Rudi Komm, Frank Hill/NSO/AURA/NSF
About the Image
| Id: | noao0002c |
| Type: | Chart |
| Release date: | March 30, 2000 |
| Related releases: | noao0002 |
| Size: | 957 x 679 px |
About the Object
| Name: | Sun |
| Category: | Illustrations Solar System |