KPNO Weather
This section contains a number of data sheets about weather and nighttime observing on Kitt Peak, compiled by D. L. Crawford. These data may give prospective observers an idea of what to expect. Note, however, large variations do occur from year to year.
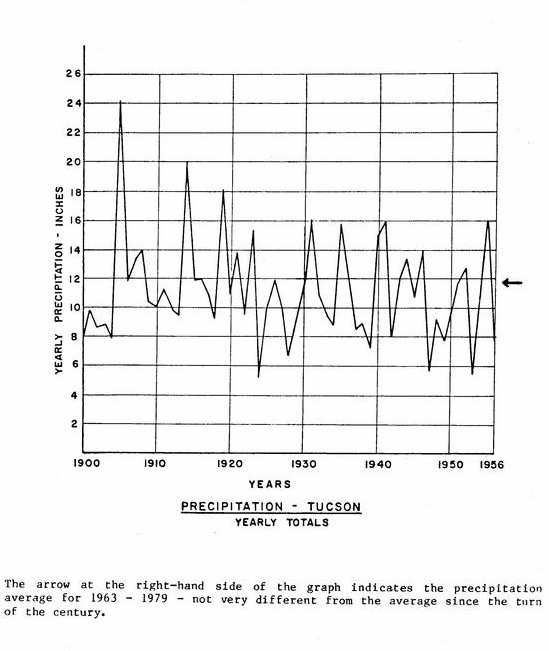
The mean fraction of useful night hours has been rather stable over the years (1950 to 1975, depending on the type of observation). Observing correlates reasonably well with "days of precipitation." July is the worst observing month, with a bit less than 50 usable time on the average. The summer rainy season (caused by intrusion of moist air from the Gulf of Mexico) usually lasts from early July to mid-September. The onset is more predictable than is the end. Kitt Peak also gets winter precipitation from Pacific storms, but the amount varies markedly from one year to the next. Total amount and asymmetry in scattered artificial light may affect some limit observations. Sky light, at an altitude of five degrees, is about four and one-half times brighter in the direction of Tucson than in the southwesterly direction, as measured in a 200A half-width spectral region centered at 4358Å. The zenith V mag background is about 10 above the natural background.
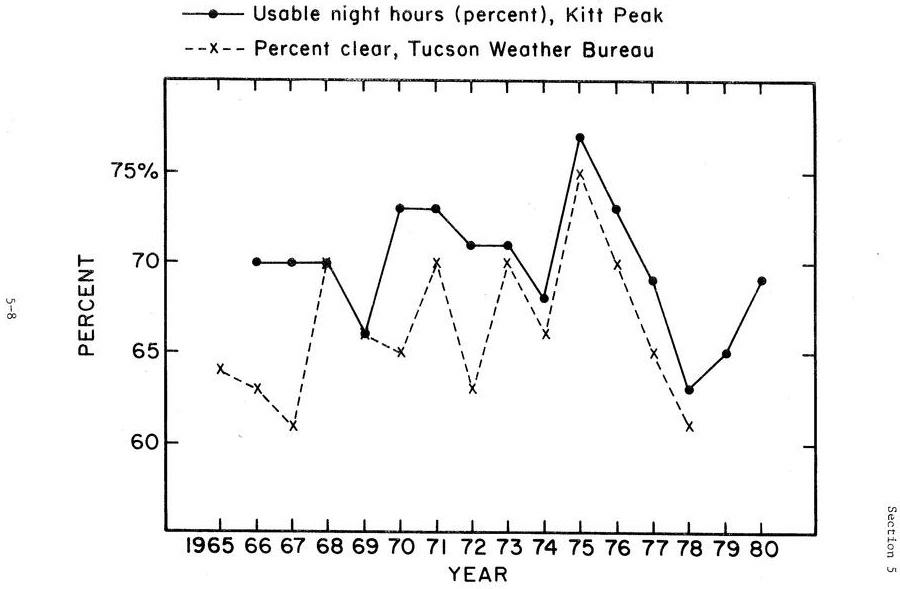
A graph shows the percentage of night hours used for observing, alongside the percentage of clear weather reported in Tucson. The "usable night hours" were derived from the 4-m and 2.1 m-telescope logs and are adjusted to take out the effects of instrument or engineering "down time." Over the 14 years shown, the average "percent clear" for Tucson is 66, compared with 65 for the last 38 years.
Readers may also be interested in looking at an article "On the Probability of Clear Daytime Skies Near Kitt Peak National Observatory," by R. G. Giovanelli (1979, P.A.S.P.. 91, 577). Giovanelli used weather records from the Tucson International Airport to derive the probability of getting a required number of clear days at KPNO during an observing period of given length.
| 1963 | 1964 | 1965 | 1966 | 1967 | 1968 | |||||||
|---|---|---|---|---|---|---|---|---|---|---|---|---|
| Month | Inches/Days | Inches/Days | Inches/Days | Inches/Days | Inches/Days | Inches/Days | ||||||
| Jan. | 1.43 | 3 | 0.29 | 1 | 1.14 | 6 | 4.36 | 5 | 0.25 | 1 | 0.87 | 7 |
| Feb. | 2.32 | 2 | 0.16 | 1 | 1.05 | 4 | 6.11 | 5 | 0.10 | 2 | 1.50 | 6 |
| Mar. | 1.10 | 2 | 1.00 | 6 | 0.79 | 4 | 0.70 | 3 | 1.31 | 4 | 2.40 | 7 |
| Apr. | 0.89 | 1 | 1.35 | 2 | 3.58 | 6 | 0.20 | 1 | 0.81 | 3 | 1.18 | 4 |
| May | 0.00 | 0 | 0.09 | 1 | 0.12 | 1 | Trace | 2 | 0.17 | 3 | 0.00 | 0 |
| Jun. | 0.37 | 1 | 0.52 | 2 | 0.39 | 2 | 0.35 | 3 | 2.69 | 2 | 0.00 | 0 |
| Jul | 2.81 | 9 | 5.51 | 12 | 2.53 | 16 | 4.01 | 15 | 4.68 | 16 | 5.20 | 10 |
| Aug. | 4.88 | 15 | 8.22 | 16 | 4.29 | 10 | 5.74 | 8 | 4.78 | 13 | 4.03 | 10 |
| Sep. | 2.94 | 9 | 2.94 | 10 | 3.55 | 8 | 2.55 | 8 | 2.53 | 8 | 2.47 | 9 |
| Oct. | 1.08 | 1 | 3.40 | 3 | 0.06 | 1 | 0.61 | 4 | 0.32 | 2 | 0.39 | 2 |
| Nov. | 1.85 | 5 | 2.01 | 4 | 1.50 | 5 | 1.94 | 3 | 1.16 | 7 | 1.06 | 4 |
| Dec- | 0-86 | 2 | 0.90 | 2 | 3.53 | 13 | 1.58 | 5 | 9.22 | 7 | 4.67 | 3 |
| Total | 20.53 | 51 | 27.00 | 58 | 31.53 | 76 | 28.13 | 62 | 27.96 | 69 | 21.76 | 53 |
| 1969 | 1970 | 1971 | 1972 | 1973 | 1974 | |||||||
| Month | Inches/Days | Inches/Days | Inches/Days | Inches/Days | Inches/Days | Inches/Days | ||||||
| Jan. | 2.01 | 8 | Trace | 1 | 0.11 | 1 | 0.00 | 0 | 0.52 | 4 | 4.60 | 8 |
| Feb. | 1.56 | 7 | 0.39 | 3 | 1.20 | 3 | 0.00 | 0 | 3.30 | 6 | 0.00 | 0 |
| Mar. | 1.23 | 5 | 3.30 | 7 | 0.00 | 0 | 0.00 | 0 | 6.04 | 10 | 1.36 | 6 |
| Apr. | 0.14 | 1 | 0.44 | 2 | 0.01 | 2 | 0.00 | 0 | 0.23 | 1 | 0.00 | 0 |
| May | 0.60 | 3 | 0.00 | 0 | 0.00 | 0 | 0.12 | 3 | 0.32 | 1 | 0.00 | 0 |
| Jun. | 0.00 | 0 | 0.00 | 0 | 0.00 | 0 | 1.94 | 8 | 0.85 | 2 | Trace | 2 |
| Jul. | 6.75 | 11 | 1.59 | 10 | 4.02 | 8 | 3.62 | 11 | 2.47 | 7 | 6.85 | 18 |
| Aug. | 7.08 | 15 | 5.77 | 13 | 11.33 | 22 | 3.74 | 8 | 2.04 | 12 | 3.03 | 7 |
| Sep. | 0.81 | 11 | 8.76 | 6 | 2.64 | 5 | 0.42 | 4 | 0.00 | 0 | 4.98 | 17 |
| Oct. | 0.04 | 1 | 0.33 | 4 | 6.91 | 10 | 8.42 | 12 | 0.00 | 0 | 3.60 | 14 |
| Nov | 3.23 | 7 | 0.11 | 2 | 0.98 | 3 | 2.37 | 7 | 1.78 | 4 | 0.00 | 0 |
| Dec. | 1.55 | 7 | 1.23 | 5 | 3.69 | 8 | 1.63 | 4 | 0.00 | 0 | 1.28 | 4 |
| Total | 25.00 | 76 | 21.92 | 53 | 30.89 | 62 | 21.25 | 57 | 17.55 | 47 | 25.68 | 76 |
| 1975 | 1976 | 1977 | 1978 | 1979 | 1980 | |||||||
| Month | Inches/Days | Inches/Days | Inches/Days | Inches/Days | Inches/Days | Inches/Days | ||||||
| Jan. | 0.60 | 3 | 0.43 | 3 | 3.29 | 12 | 4.06 | 11 | 8.90 | 10 | 2.48 | 9 |
| Feb. | Trace | 1 | 1.65 | 7 | 0.16 | 1 | 3.84 | 11 | 2.04 | 4 | 4.49 | 10 |
| Mar. | 3.88 | 7 | 0.72 | 1 | 0.96 | 3 | 3.79 | 8 | 2.44 | 7 | 2.05 | 6 |
| Apr. | 1.82 | 3 | 2.38 | 3 | 0.69 | 2 | 0.63 | 3 | 0.03 | 2 | 0.30 | 3 |
| May | 0.00 | 0 | 0.00 | 0 | 0.22 | 1 | 2.23 | 3 | 0.92 | 9 | 0.22 | 2 |
| Jun. | 0.00 | 0 | 0.00 | 0 | 0.00 | 0 | 0.65 | 3 | 1.09 | 7 | 0.11 | 1 |
| Jul. | 6.77 | 19 | 6.71 | 16 | 2.90 | 11 | 4.37 | 17 | 4.22 | 9 | 3.12 | 9 |
| Aug. | 1.80 | 7 | 2.18 | 7 | 3.00 | 9 | 1.93 | 13 | 2.63 | 8 | 4.47 | 9 |
| Sep. | 2.99 | 7 | 4.74 | 10 | 0.56 | 8 | 1.88 | 5 | 0.55 | 4 | 1.12 | 4 |
| Oct. | 0.00 | 0 | 1.47 | 6 | 3.20 | 10 | 3.82 | 8 | 0.78 | 1 | 0.87 | 3 |
| Nov. | 1.75 | 1 | 0.89 | 3 | 0.54 | 3 | 5.59 | 11 | 0.31 | 2 | 0.02 | 1 |
| Dec. | 2.42 | 6 | 0.73 | 4 | 2.58 | 6 | 10.96 | 8 | 0.46 | 4 | 0.41 | 3 |
| Total | 22.03 | 54 | 21.90 | 60 | 18.10 | 66 | 43.76 | 101 | 24.37 | 67 | 19.66 | 60 |


The following two figures shows the anti-correlation between the number of days of precipitation on Kitt Peak and the monthly percentage of night hours used for observing. Numbers for the bottom graph were derived from the 4-meter and 2.1-meter telescope logs. An adjustment was made for instrument or engineering "down-time," so that these percentages show only the effect of weather on observing time. Bars reflect a standard deviation in the average.


Updated on May 7, 2021, 8:13 am